What Does Phenotype Means in Clinical Data Analytics
In the simplest terms, a phenotype is the observable story a patient's health tells. It's the collection of expressed traits-like a specific diagnosis, a lab result, or even their height-that we can see and measure. This is fundamentally different from their genotype, which is the underlying genetic blueprint responsible for those traits.
Decoding Phenotypes in Modern Healthcare Data

A great way to think about this is with a building analogy. The genotype is the architect's blueprint-a detailed set of instructions outlining the building's potential. The phenotype is the finished building itself. It reflects the original plan, sure, but it's also shaped by environmental factors like weather, the quality of construction materials, and any changes made along the way.
In a clinical setting, this distinction is everything. A patient's genes might show a predisposition for a certain condition, but their phenotype tells us whether that condition has actually appeared. This includes everything from a formal diagnosis of Type 2 Diabetes to specific measurements like blood pressure or cholesterol levels.
To make the distinction even clearer, here’s a quick breakdown.
Phenotype vs Genotype at a Glance
| Concept | Definition | Example | How It's Determined |
|---|---|---|---|
| Phenotype | The observable physical or biochemical traits of an organism. | Blue eyes, high blood pressure, Type 2 Diabetes. | Observation, clinical assessment, lab tests. |
| Genotype | The specific genetic makeup or set of genes in an organism's DNA. | The BRCA1 gene mutation, the specific alleles for eye color. | DNA sequencing, genetic testing. |
This table highlights the core difference: one is what you see, and the other is the code that helps create it.
The Rise of the Computable Phenotype
While the biological definition is our starting point, the real magic happens when we apply this concept to the massive datasets found in Electronic Health Records (EHRs). Here, the idea evolves into what we call a computable phenotype. This isn't just a loose concept; it's a precise, algorithmic definition we use to automatically identify specific patient groups from messy clinical data.
Think of a computable phenotype as a highly sophisticated search query. Instead of looking for a single data point, it combines several to build a much more accurate patient profile.
For example, a simple search for "hypertension" might pull thousands of records, but many could be inaccurate. A computable phenotype algorithm would be far more specific:
- Find patients with at least two separate outpatient visits coded with a hypertension diagnosis.
- Confirm they have an active prescription for an antihypertensive medication.
- Verify their systolic blood pressure readings are consistently above 140 mmHg.
This layered approach gives us a much more reliable and accurate way to assemble patient cohorts for research, clinical trials, or population health studies.
A computable phenotype is a clinical condition, characteristic, or set of characteristics that can be determined solely from data in EHRs and ancillary data sources, without requiring chart review or any other data collection outside of the EHR.
For those of us working with platforms like OMOPHub, this shift from a biological observation to a computable algorithm is central to everything we do. It’s what allows us to pull meaningful insights from vast datasets, especially when working within standardized frameworks like the OMOP Common Data Model. If you want to go deeper, you can explore more definitions of electronic health records-based phenotyping.
The Journey from Biological Trait to Computable Algorithm
The meaning of "phenotype" has changed quite a bit over the years. It started as a simple biological observation, but it's now a sophisticated computational tool. This evolution really picked up speed thanks to two major forces: the explosion of data from Electronic Health Records (EHRs) and the completion of the Human Genome Project back in 2003. All of a sudden, researchers had their hands on a staggering amount of both genetic and clinical information.
This created a brand new, very pressing problem. While the genetic data was neat and tidy, the clinical information-the stuff describing actual patient traits-was often a complete mess. Early genetic linkage studies frequently stumbled, not because the genetic data was wrong, but because the phenotypes were defined too vaguely. If you want to reliably connect a gene to a disease, you need a rock-solid, reproducible definition of that disease.
The Shift to a Disease Classifier
To fix this, our whole understanding of a phenotype had to evolve. It went from being a general description to a disease classifier-a precise, machine-readable algorithm.
Think of it like a powerful, custom-built search filter for a massive patient database. It’s a set of logical rules designed to sift through millions of records and pull out only the patients who match a very specific, complex set of criteria.
This shift was a true turning point. It gave researchers the ability to define conditions with the same kind of rigor found in genomic data. For example, instead of vaguely searching for "asthma," an algorithm could specify: "patients with at least two outpatient diagnosis codes for asthma, plus a prescription for an inhaled corticosteroid, but no diagnosis codes for COPD." This kind of thinking turns messy, real-world data into clean, analyzable cohorts.
In essence, a modern computable phenotype is a set of instructions. It might be a series of rule-based heuristics using specific medical codes, or it could be a more complex probabilistic model. Either way, the goal is to accurately flag members of a target cohort.
The need for this kind of rigor became painfully obvious in the years after the Human Genome Project. A widely cited 2004 review drove this point home, showing how fuzzy phenotype definitions were derailing genetic studies. This pushed the entire field to create more formal "research diagnoses" and even use genetic markers to refine clinical traits-a practice sometimes called "reverse phenotyping." You can see this evolution in action in discussions within observational research forums. See how the OHDSI community defines a phenotype.
Why Algorithmic Definitions Matter
Using algorithms to define phenotypes isn't just a neat trick; it's absolutely fundamental for anyone working with observational health data today. It's what makes modern research transparent, reproducible, and scalable.
When a research team in Boston designs a phenotype algorithm for heart failure, another team in London can take that exact same logic and apply it to their own data. This ensures their results are actually comparable.
This level of standardization is the bedrock for building reliable evidence from real-world data. It moves us away from subjective interpretations and toward a much more objective, data-driven way of understanding disease. It's this algorithmic foundation that lets us explore everything from treatment effectiveness to disease progression with a confidence that just wasn't possible before. This is also why structured knowledge systems are so important, which we discuss in our article on gene ontology.
Anatomy of a Computable Phenotype Algorithm
When we talk about a computable phenotype, we're not just talking about a single billing code. That’s a common misconception. Think of it more like a detailed recipe, an algorithm that combines different ingredients from a patient's record to paint a clear and accurate clinical picture.
Why the complexity? Because relying on a single piece of information, like one diagnosis code, is a recipe for disaster in clinical research. It's incredibly unreliable. Clinical data is messy, and a diagnosis code might be entered to "rule out" a condition, it could be a simple mistake, or it might just fail to capture the whole story. A well-designed phenotype algorithm cuts through that noise by weaving together multiple threads of evidence.
This is where the road forks. A biological phenotype is an observable trait, like eye color or a high blood pressure reading. But the moment you need to find a group of patients with that trait in a database, it has to become computable. It must be defined by rules a computer can understand.
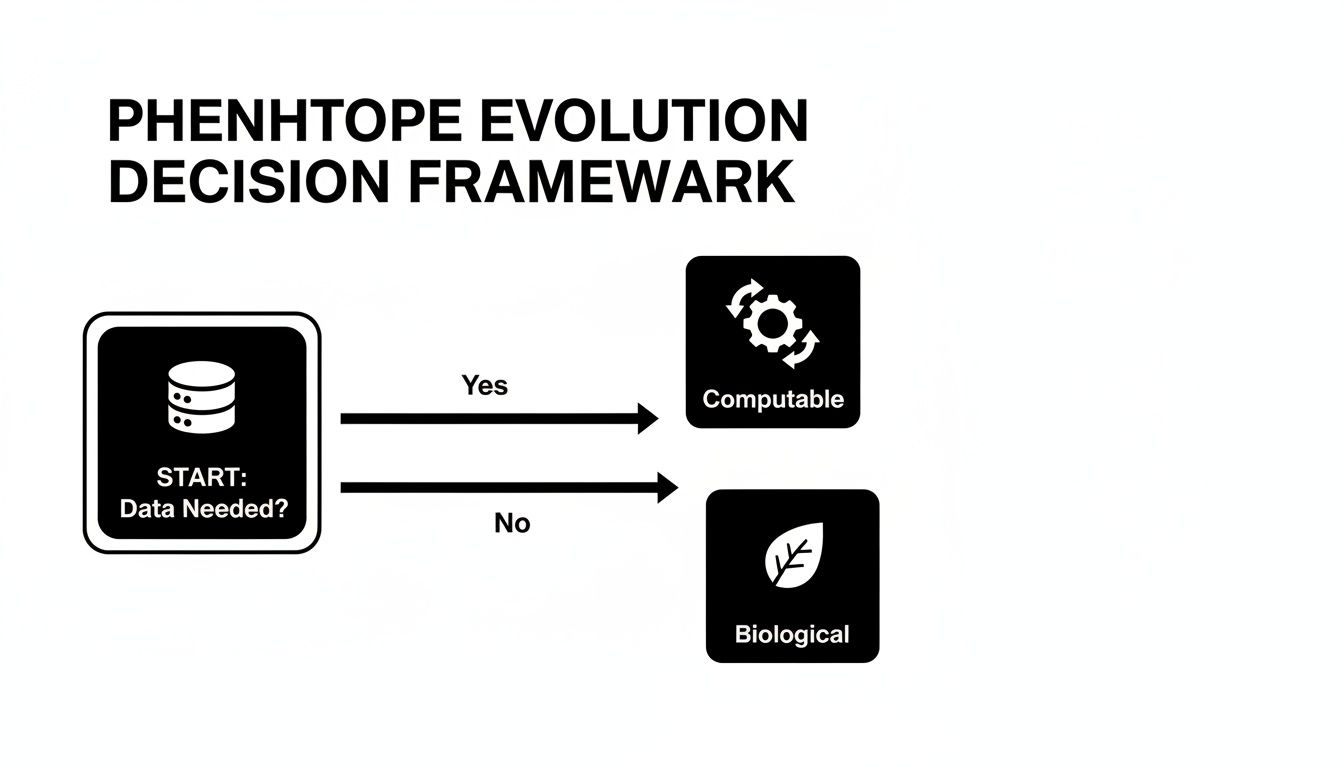
The flowchart shows it perfectly. As soon as you need to query data, your concept has to evolve into a set of machine-readable instructions.
Building Blocks of a Phenotype Algorithm
So what are the ingredients in this recipe? A strong phenotype algorithm pulls from several distinct areas within an Electronic Health Record (EHR). Critically, the data from these areas must be mapped to standard vocabularies to ensure everyone is speaking the same language. This process is often called semantic mapping, and it’s a non-negotiable step for creating consistent, reliable cohorts.
The most common building blocks include:
- Conditions: Diagnosis codes (like ICD-10-CM or SNOMED CT) that state what’s wrong with the patient.
- Procedures: Codes that document what was done to the patient, from major surgery (CPT) to simple tests.
- Drug Exposures: Prescriptions and administrations (often using RxNorm) provide powerful evidence that a condition is being actively treated.
- Measurements: This is the hard data-lab results (LOINC), vital signs, and other numbers that can confirm or refute a diagnosis.
By combining these elements with specific rules and timelines-like "this diagnosis must appear before that prescription"-we build a definition that is both precise and reproducible.
A Concrete Example: Pinpointing Type 2 Diabetes
Let's make this real. Imagine you need to identify every patient with Type 2 Diabetes Mellitus (T2DM). The rookie move would be to just grab everyone with the ICD-10-CM code E11.9 ("Type 2 diabetes mellitus without complications"). But an experienced researcher knows that’s not nearly good enough.
A far more accurate algorithm layers evidence to build a much stronger case. This table breaks down what that looks like in practice.
Example Phenotype Algorithm for Type 2 Diabetes
| Data Element | Vocabulary | Example Inclusion Criteria | Example Exclusion Criteria |
|---|---|---|---|
| Diagnoses | ICD-10-CM, SNOMED | At least 2 T2DM codes on different dates; or 1 inpatient T2DM code. | Any code for Type 1 Diabetes; any code for Gestational Diabetes. |
| Medications | RxNorm | At least 1 prescription for Metformin, Glipizide, or other T2DM drug. | A prescription for insulin as the only diabetes medication. |
| Lab Results | LOINC | Hemoglobin A1c >= 6.5%; or Fasting Glucose >= 126 mg/dL. | Consistently normal blood glucose levels over time. |
This multi-faceted approach transforms a simple query into a robust clinical definition. By requiring multiple points of evidence, we filter out "rule-out" diagnoses and accidental coding errors, ensuring the final cohort is truly representative of the condition we're studying.
This is the fundamental blueprint for turning messy, raw EHR data into a high-quality, research-grade cohort.
How OMOPHub Accelerates Phenotype Development
Moving from the theory of a phenotype algorithm to actually building one is where the real work begins. It’s a process that demands powerful, specialized tools, and this is exactly where a platform like OMOPHub comes in. Think of it as a force multiplier for research teams. It handles the heavy lifting of data standardization and vocabulary management, freeing you up to focus on the clinical logic that defines your phenotype.
The entire system is built on the foundation of the OMOP Common Data Model (CDM). By creating a standardized structure for health data, the CDM is what makes your phenotype algorithm portable. An algorithm you build to identify Type 2 Diabetes at one hospital can be run reliably on data from an institution halfway across the world, as long as both datasets are mapped to the OMOP CDM. You can get a much deeper understanding of this in our guide to the OMOP data model.
Unlocking Vocabularies with the OMOPHub API
If the CDM is the structure, then the OMOP vocabularies are the language. Any good phenotype algorithm depends on accurately identifying and mapping codes from dozens of different systems-ICD-10-CM, SNOMED CT, RxNorm, and LOINC, to name a few. Just managing these massive, constantly changing terminologies is a huge engineering headache.
This is the exact problem the OMOPHub REST API was designed to solve. It completely removes the need to host, version, and query these complex clinical vocabularies yourself. Instead of spinning up and maintaining a local database instance of the OHDSI ATHENA vocabularies, your team gets programmatic access through a high-performance API.
OMOPHub gives you instant, reliable access to the standardized terminologies that are the building blocks of any computable phenotype. This shifts the team's focus from managing infrastructure to driving clinical and scientific discovery.
This API-first approach means you can plug vocabulary services right into your data pipelines, analytical scripts, and research applications without taking on all the operational overhead.
Making Workflows Flow with SDKs
To make things even more straightforward, OMOPHub provides Software Development Kits (SDKs) for both Python and R-the two most common languages in data science and biostatistics. These SDKs are essentially convenient wrappers around the REST API, letting you perform complex vocabulary searches and mappings with just a few lines of code.
For example, instead of manually hunting for every relevant ICD-10 code for hypertension and then trying to find their corresponding SNOMED concepts, you can automate the whole process. This is absolutely critical when you're building the inclusion and exclusion criteria that form the heart of a computable phenotype.
Here are a few common tasks you can automate right away:
- Concept Searching: Programmatically find standard concepts by their name, code, or domain.
- Relationship Traversal: Explore the hierarchy of concepts. For instance, you could find all descendants of a broad condition like "Malignant neoplasm."
- Cross-Vocabulary Mapping: Seamlessly translate codes from a source vocabulary (like ICD-10-CM) to their standard SNOMED CT equivalents.
A Look at the Code in Practice
Let's see what this looks like. Imagine you're building a phenotype for atrial fibrillation and need to find the standard SNOMED concept for the ICD-10-CM code I48.91.
Using the OMOPHub Python SDK, the code is remarkably simple:
from omophub import OmopHub
client = OmopHub(api_key="YOUR_API_KEY")

# Find concepts by source code and vocabulary
response = client.concepts.search(
    vocabulary_id="ICD10CM",
    concept_code="I48.91",
    include_standard_concepts=True
)

# Print the standard concept mapping
for concept in response.items:
    for mapping in concept.standard_concept_maps:
        print(f"Standard Concept ID: {mapping.concept_id}")
        print(f"Standard Concept Name: {mapping.concept_name}")
This tiny script instantly finds the correct mapping, which not only saves a ton of time but also drastically reduces the risk of manual error.
Top Tips for Getting Started with OMOPHub SDKs:
- Read the Docs: The official documentation is your best friend here. It’s packed with detailed examples for every endpoint. You can find it at docs.omophub.com.
- Start with Simple Lookups: Get a feel for the workflow by using the SDKs for basic tasks, like looking up a single concept by its name or code.
- Automate Concept Set Creation: Use the SDKs to build and maintain the lists of codes (concept sets) for your phenotype definitions. This makes your algorithms more transparent and way easier to update down the line.
- Check Out the GitHub Repositories: For more advanced examples or to see what’s happening under the hood, visit the official SDK repositories for Python and R.
By integrating these tools into your workflow, you can dramatically speed up how you develop, validate, and deploy accurate and reproducible phenotype algorithms.
A Practical Framework for Designing and Validating Phenotypes

Writing a computable phenotype algorithm is one thing; proving it actually finds the right patients is another game entirely. A clever algorithm is worthless if the results can't be trusted. This validation process is what elevates a simple query into a research-grade instrument, ensuring the insights you pull from the data are credible and, just as importantly, reproducible.
The foundation of any strong phenotype is a meticulously crafted set of inclusion and exclusion criteria. These rules form the logical heart of your algorithm, explicitly defining who gets into your cohort and-critically-who stays out. Think of it as being the bouncer for an exclusive club: the inclusion criteria are your guest list, while the exclusion criteria are the reasons you turn people away at the door. It's how you prevent misclassification and protect the integrity of your study group.
To get from a clinical idea to a validated phenotype you can hang your hat on, you need a structured framework. A systematic approach brings rigor and transparency to every step.
The Four-Step Phenotype Playbook
Following a defined process takes the guesswork out of the equation and builds confidence in your final cohort. While the details can shift, any reliable workflow is going to follow these four essential steps.
- Define the Clinical Idea and See What's Been Done: Start with a crystal-clear definition of the condition. What does it really mean to have this disease? Then, hit the literature. See how other researchers have defined this phenotype, paying close attention to the specific data elements (diagnoses, meds, labs) and logic they used. No need to reinvent the wheel if you don't have to.
- Develop the Algorithm: Now, translate that clinical definition into code. This is where you formalize your inclusion and exclusion rules using standard terminologies. You might use tools like the OMOPHub SDKs to build out your concept sets. A classic example would be requiring "at least two outpatient ICD-10-CM codes for rheumatoid arthritis 60 or more days apart" while explicitly excluding anyone with a competing diagnosis like psoriatic arthritis.
- Execute and Refine: Run your first-draft algorithm against the data and see what you get. This initial run is really a sanity check. Are the patient counts wildly off from what you'd expect? Are you seeing strange patterns? This is an iterative loop-you’ll likely tweak and refine your logic based on what the real-world data tells you.
- Validate Against a Gold Standard: This is the moment of truth. You have to compare your algorithm's results against a source of truth, which is almost always a manual review of patient charts by a clinical expert. This step measures how well your logic performs in the messy reality of clinical practice.
Measuring What Matters Most
Validation isn't just a simple pass/fail grade; it’s about calculating specific performance metrics. If you're really trying to answer "what does phenotype means" in a data-driven context, you have to understand these numbers. They quantify the accuracy of your definition.
In phenotype validation, you are constantly balancing the need to find every true case with the need to avoid including false cases. Metrics like sensitivity and PPV help you measure and optimize that balance.
Let’s break down the most important metrics. Imagine your algorithm is a fishing net you've designed to catch only salmon.
-
Sensitivity (Recall): Of all the actual salmon in the river, how many did your net manage to catch? High sensitivity means you're good at finding the true positive cases that are there.
-
Specificity: Of all the other fish in the water-the trout, the bass, the carp-how many did your net correctly ignore? High specificity means your algorithm excels at rejecting true negatives.
-
Positive Predictive Value (PPV): Of everything you caught in your net, what percentage was actually salmon? A high PPV means that when your algorithm flags a patient, you can be very confident it's a true case.
Each metric tells a different part of the story. A phenotype designed for a rare disease surveillance system might prioritize sky-high sensitivity to make sure no case is missed. On the other hand, a clinical trial recruiting patients for a new drug will demand an extremely high PPV to ensure the study cohort is pure. Following this framework lets you build and test phenotypes that produce results you can truly stand behind.
Common Phenotyping Mistakes and How to Avoid Them
Even the most experienced data scientists can fall into a few common traps when building phenotype algorithms. It's easy to do, especially with the complexities of real-world clinical data. Knowing what these pitfalls are ahead of time is the best way to build algorithms that are both reliable and reproducible.
Relying Only on Billing Codes
One of the most frequent mistakes is putting too much faith in billing codes alone, like ICD-10-CM. Remember what these codes are for: reimbursement. They weren't designed for clinical precision.
A diagnosis code might be on a patient's record simply because a doctor was trying to "rule out" a condition, not because it was a confirmed diagnosis. If you build a cohort based solely on that code, you'll inevitably pull in patients who don't actually have the disease, skewing your entire analysis.
Tip for Accuracy: Never trust a single data point. Always look for corroborating evidence to strengthen your case. Pair a diagnosis code with a prescription for a condition-specific medication (found with RxNorm) or a confirmatory lab result (identified via LOINC).
Ignoring the Dimension of Time
Clinical data tells a story, and that story unfolds over time. The order of events is everything, and if your phenotype algorithm ignores this, it's logically flawed from the start.
For example, a diagnosis must come before a treatment. If you find a record where a patient received medication for a specific condition months before any diagnosis was ever recorded, that’s a major red flag that requires investigation. Overlooking this temporal logic can lead to completely wrong conclusions about how a disease progresses or how effective a treatment is.
It’s also crucial to consider how coding practices change. A condition might have been documented with a totally different code five years ago. If you don't account for these historical codes, you'll miss a whole chunk of otherwise eligible patients.
Overlooking the Nuance Between Genotype and Phenotype
Finally, it's easy to get lost in the data and forget the fundamental biology. A phenotype is the observable trait-it's what we can see or measure. It stands in contrast to the genotype, which is the underlying genetic code. Genome.gov offers a great primer on this distinction.
Your phenotype could be your height, your blood type, or a diagnosed disease. These traits are shaped by a mix of genetics and environment. Mistaking a genetic predisposition for an expressed condition is a critical error that can completely contaminate your cohort.
Common Pitfalls Checklist:
- Over-reliance on Single Data Points: Are you using diagnosis codes in a vacuum, without backup from medications or labs?
- Temporal Blindness: Does your logic confirm that diagnoses happen before treatments? Are your observation windows defined correctly?
- Vocabulary Drift: Have you included older or retired codes that might still appear in historical data?
Steering clear of these mistakes is what truly answers the question, "what does phenotype mean?" in a practical, computable sense. It's how we ensure our algorithms are accurate reflections of clinical reality, not just lines of code.
Frequently Asked Questions About Clinical Phenotyping
As we've walked through the process of turning a biological trait into a computable algorithm, a few common questions always seem to pop up. Let's tackle some of the practical challenges and best practices you'll run into when working with clinical phenotypes.
Can a Phenotype Change Over Time?
Absolutely. A person's phenotype is never static; it’s a living snapshot of their health. Think about how age, lifestyle choices, where you live, and new treatments can all shift the observable traits we see in the data.
For example, a patient's Type 2 Diabetes phenotype can look very different after they start a new medication. You might see their HbA1c levels steadily improve in their EHR records. This is precisely why building temporal logic-understanding the sequence and timing of events-is so critical when you design a phenotype algorithm.
How is a Phenotype Different from a Cohort?
This is a subtle but crucial distinction that often trips people up.
A phenotype algorithm is the set of rules, the recipe, you create to find patients who match a specific clinical profile. The cohort is the actual list of patients you get back after running that recipe against a dataset.
Here's a simple way to think about it:
- Phenotype Algorithm: The search query you carefully write.
- Cohort: The search results that query returns.
The algorithm is the tool; the cohort is the output. You can't have a reliable, reproducible cohort without a well-defined phenotype algorithm behind it.
Why Not Just Use Machine Learning for Everything?
Machine learning models are fantastic at spotting complex patterns in data that a human-written, rule-based algorithm might completely miss. The trade-off? They often operate like "black boxes," which makes it tough to explain exactly why a specific patient was flagged as having the condition.
Rule-based algorithms, on the other hand, are completely transparent. Every single inclusion and exclusion rule is spelled out, making it straightforward for a clinical expert to review and validate the logic.
Many teams find a hybrid approach works best. They might start with a clear, rule-based algorithm and then use ML models to help refine the logic or identify potential patients who were missed. This is also where understanding issues like bias, fairness, and explainability in ML becomes incredibly important.
Where is the Best Place to Find Existing Phenotype Algorithms?
The good news is you don't always have to reinvent the wheel. Several great initiatives have built public libraries of validated phenotype algorithms that you can adapt for your own work.
A fantastic starting point is the OHDSI Phenotype Library. It’s packed with definitions for a huge range of conditions, and they're all designed to run on data formatted to the OMOP Common Data Model. Using a pre-built, validated algorithm can save you a massive amount of time and effort.
Ready to stop wrestling with vocabulary databases and accelerate your phenotype development? With OMOPHub, you get instant REST API access to all OHDSI ATHENA vocabularies, backed by powerful SDKs for Python and R. Eliminate infrastructure headaches and ship your data pipelines faster and with confidence. Start building today with OMOPHub.


