Warm autoimmune hemolytic anemia: A Practical Guide for OMOP Data Scientists
Warm autoimmune hemolytic anemia (wAIHA) is a tricky diagnosis. It's a rare disorder where a person's immune system gets its wires crossed and starts destroying its own red blood cells, all at or near normal body temperature. This self-inflicted attack leads to anemia, but for data scientists and clinical researchers, the real problem starts much earlier: how do you even find these patients in a sea of messy electronic health record (EHR) data?
From Clinical Suspicion to Computable Phenotype
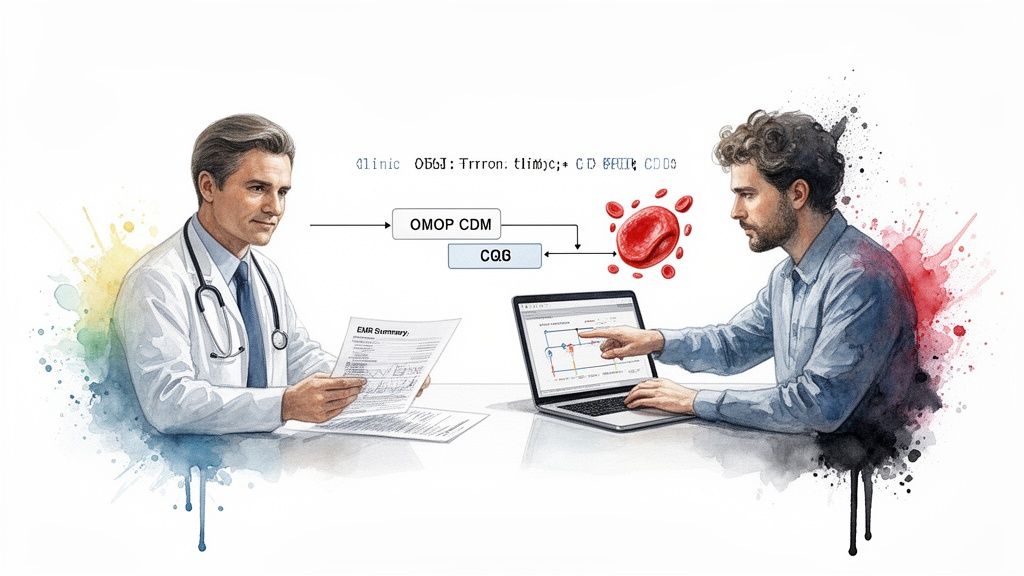
The path from a physician's diagnosis of wAIHA to a research-ready dataset is less of a straight line and more of a complex translation effort. A clinician sees a patient presenting with fatigue, jaundice, or shortness of breath. A data engineer, on the other hand, sees a chaotic jumble of data points-scattered lab results, cryptic diagnostic codes, and unstructured clinical notes-that have to be pieced together like a puzzle.
The fundamental job here is to translate that rich clinical story into a structured, queryable format. This isn't just a technical exercise; it's about building a coherent digital picture of the patient's journey. Without a common data structure, information from different hospitals, or even different departments, simply won't talk to each other. That incompatibility can bring large-scale research to a grinding halt.
The diagram below maps out this entire workflow, showing how raw, real-world data from an EHR is systematically cleaned, structured, and organized into a research-grade cohort of wAIHA patients.
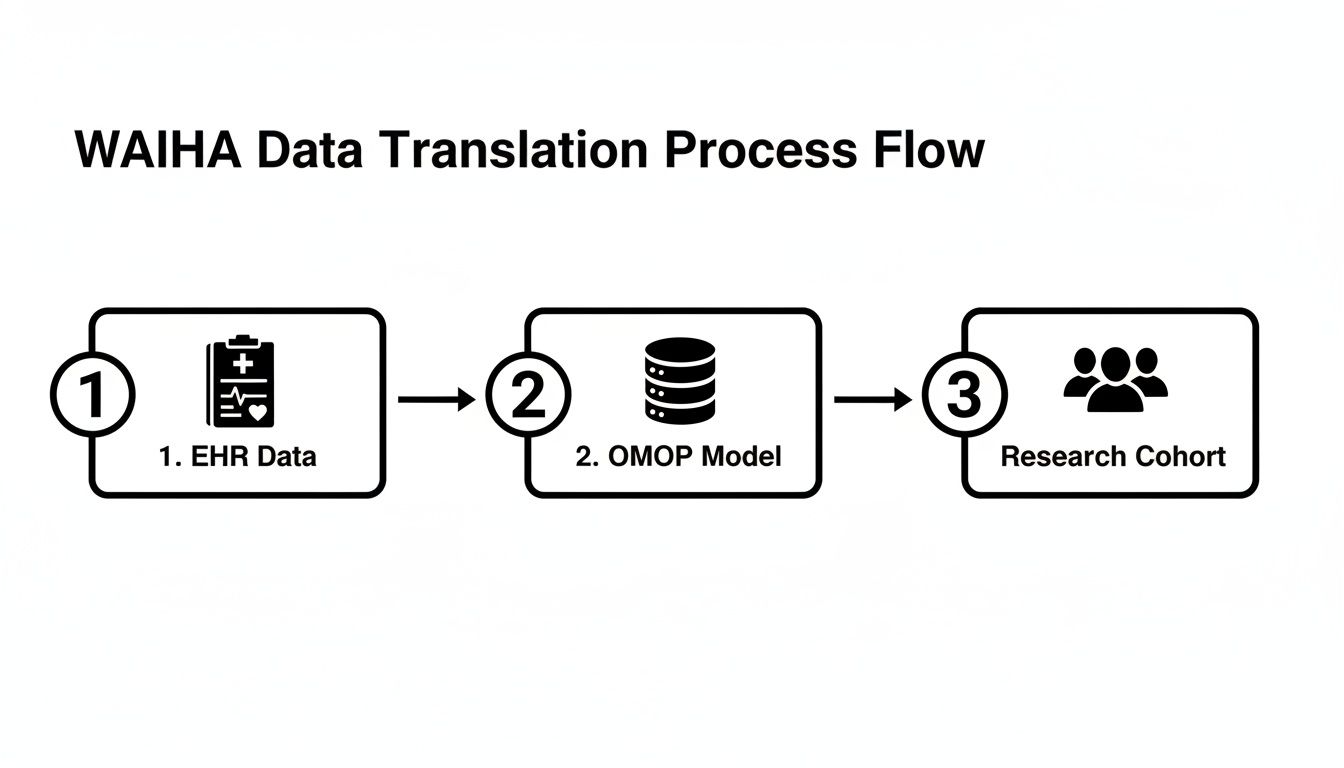
This process really underscores why a standardized framework is absolutely essential. It's the bridge connecting what happens in the clinic with what's possible in large-scale data analysis.
Why a Common Data Model is Non-Negotiable
This is where the Observational Medical Outcomes Partnership (OMOP) Common Data Model (CDM) becomes the cornerstone of the whole operation. It provides the architectural blueprint for organizing health data, imposing a consistent structure and a common vocabulary regardless of where the data originated.
Think of it as a universal translator for healthcare data. The OMOP CDM ensures that a diagnosis code for wAIHA from a small rural clinic means the exact same thing as one from a major urban hospital system. You can get a much deeper look at how this works in our comprehensive guide on the OMOP Data Model.
By taking the time to convert raw EHR data into the OMOP CDM, we're not just tidying up a database; we're creating a profoundly powerful resource. Researchers can then:
- Build reliable patient cohorts: Confidently identify groups of wAIHA patients using consistent, well-defined criteria.
- Perform reproducible analyses: Run the same study on different OMOP-formatted databases and trust that the results are comparable.
- Drastically shorten research timelines: Bypass the agonizing, time-sucking process of manually harmonizing data from dozens of different sources.
The real objective is to get past the textbook definition and start decoding the digital footprint of warm autoimmune hemolytic anemia. Doing so lets us study the disease on a population scale, revealing patterns in treatment efficacy, outcomes, and disease progression that would otherwise remain hidden within the records of individual patients.
This guide is your roadmap for that entire process. We'll walk through the practical steps, focusing on how to use standardized data and tools like OMOPHub to push the boundaries of rare disease research.
Understanding the Scope and Impact of WAIHA
Before we can build meaningful models or design effective studies, we need to get a handle on the scale of the problem. That's where epidemiology comes in. For warm autoimmune hemolytic anemia (wAIHA), understanding the numbers provides the essential context-it tells us how common this disease is, who it affects, and helps data scientists anticipate challenges like small cohort sizes or sparse data. It’s the first step in turning a rare disease into something we can actually quantify and study.
It’s important to realize that wAIHA isn’t just one flavor of autoimmune hemolytic anemia (AIHA); it's the dominant one by a long shot. Globally, wAIHA makes up a staggering 60%-70% of all AIHA cases. For anyone working with real-world health data, this means wAIHA will be the primary focus of most clinical questions and observational research in this space.
So, how rare is it? Looking at AIHA as a whole, estimates place the annual incidence somewhere between 1 in 35,000 to 1 in 80,000 people in North America and Western Europe. A multi-database analysis in the U.S. pins the incidence rate at 1.4 to 6.6 per 100,000 individuals, with wAIHA leading the pack.
A 2017 forecast across seven major markets (US, EU5, and Japan) estimated the total prevalence of wAIHA at 82,045 cases. The United States accounted for the largest slice of that pie, with 32,138 cases. You can dig deeper into these epidemiological findings on rarediseases.org.
Patient Demographics and Clinical Context
Knowing how many people are affected is one thing, but knowing who they are is just as critical. While wAIHA can appear at any age, there’s a clear trend: its incidence often peaks in people between 50 and 70 years old. The median age of onset hovers right around 52 years.
This demographic profile is a crucial piece of the puzzle for researchers. It immediately signals that comorbidities related to aging will be a common feature in any wAIHA patient cohort, making the data landscape much more complex.
Patients in this age group are far more likely to present with:
- Multiple chronic conditions: Think hypertension, diabetes, or cardiovascular disease, all of which can act as confounders in an analysis.
- Polypharmacy: The use of multiple medications makes it incredibly tricky to isolate the effects of wAIHA-specific treatments.
- A lengthy medical history: This translates into dense, complicated electronic health records that demand careful, nuanced parsing.
Tip: For a data engineer, this reality means that firing off a simple query based on a single diagnosis code just won't cut it. Building a clean, reliable wAIHA cohort requires sophisticated logic to filter out the noise and untangle the complexity inherent in the data of an older patient population.
The Power of Standardized Data in Rare Disease Research
Traditional epidemiological figures give us a solid starting point, but they’re often born from limited registries or specific regional studies. This is where the OMOP Common Data Model (CDM) becomes so powerful. It gives us a way to validate and even expand on these numbers using massive, diverse, real-world datasets from millions of patients.
By mapping data from different healthcare systems to the OMOP standard, we can conduct federated network studies. This approach lets us aggregate insights without ever sharing patient-level data, which elegantly sidesteps privacy barriers and enables analyses with far greater statistical power.
Through these studies, we can sharpen our understanding of wAIHA's true prevalence, spot regional variations, and maybe even uncover risk factors or demographic patterns nobody knew existed. It’s how we turn abstract statistics into actionable knowledge that can genuinely improve patient care.
Piecing Together the WAIHA Diagnosis from Health Data
Finding a patient with warm autoimmune hemolytic anemia (wAIHA) in a massive electronic health record database isn't about finding a single diagnosis code. It's more like digital detective work. We're looking for a specific pattern of evidence, a distinct signature left behind by the clinical journey, from initial symptoms to the final confirmatory tests.
Think of it this way: a patient’s complaints of severe fatigue or jaundice set off a chain reaction of clinical investigations. Every lab test ordered and every result that comes back is another breadcrumb. Our job is to follow that trail of data points to build a reliable patient profile.
From Symptoms to Structured Data
The first and most critical step is to find the raw evidence of anemia and red blood cell destruction-hemolysis-in the structured lab data. Long before a formal diagnosis code is ever assigned, the lab results tell the story. This is where the real analytical work begins.
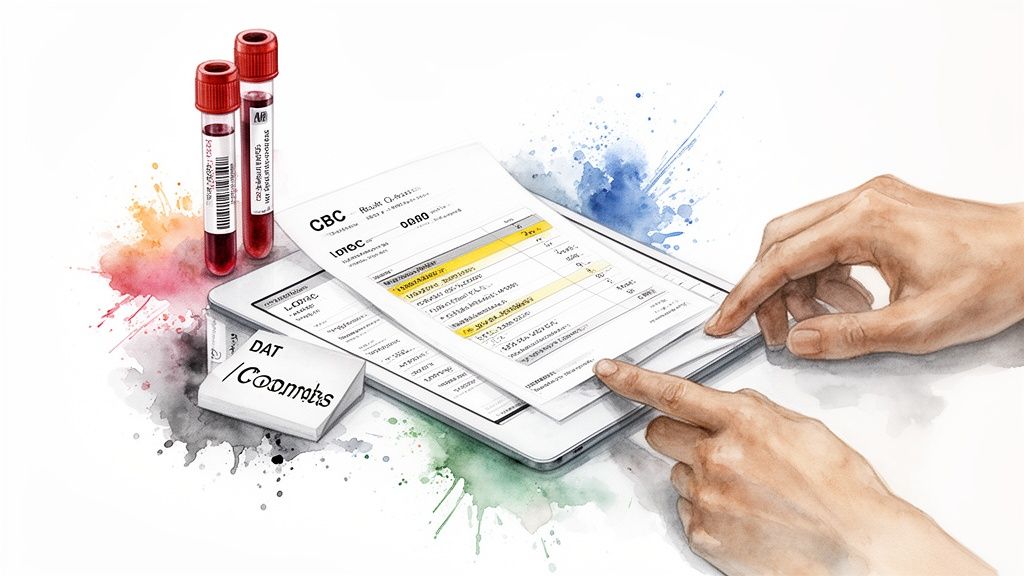
You’ll find the core pieces of this diagnostic puzzle in standard, routine lab panels. These are captured with high fidelity in most health systems. We’re looking for a few key things:
- Complete Blood Count (CBC): This is ground zero. A low red blood cell count, along with low hemoglobin and hematocrit, is the classic signal for anemia.
- Peripheral Blood Smear: When a pathologist looks at the blood under a microscope, they might see spherocytes. These small, spherical red blood cells are a dead giveaway for the extravascular hemolysis that characterizes wAIHA.
- Hemolysis Markers: A classic triad of findings-high lactate dehydrogenase (LDH), elevated indirect bilirubin, and rock-bottom haptoglobin-all point to red blood cells being destroyed prematurely.
Additionally, since AIHA often occurs in the context of other autoimmune disorders, looking for broader autoimmune markers can be incredibly useful. For example, results from an ANA Blood Test can help paint a more complete picture of the patient's underlying condition.
The Direct Antiglobulin Test: The Smoking Gun
While the labs mentioned above build a strong circumstantial case for hemolytic anemia, one test clinches the autoimmune part of the diagnosis: the Direct Antiglobulin Test (DAT), often called the Coombs test. This is the absolute linchpin for any wAIHA phenotyping algorithm. If you're new to this concept, our guide on what a phenotype means in this context can provide more background.
A positive DAT is our smoking gun. It proves that antibodies have latched onto the patient's red blood cells, which is the root cause of the destruction. Specifically for wAIHA, the DAT is typically positive for IgG antibodies, sometimes along with the complement protein C3d.
Tip: In the OMOP world, a positive DAT is the single most powerful piece of evidence you'll find in the
MEASUREMENTtable to lock in a wAIHA diagnosis. It’s what separates autoimmune hemolysis from all other causes, making it non-negotiable for building a high-fidelity patient cohort.
Translating Clinical Clues into Code with LOINC
To turn these clinical rules into something a computer can understand and execute, we need a common language. That's where LOINC (Logical Observation Identifiers Names and Codes) becomes essential. LOINC assigns universal codes to lab tests, allowing us to search for them consistently across different hospitals and health systems.
This table maps the key lab tests for a wAIHA workup to their LOINC codes, making it easier to build robust queries in an OMOP environment.
| Laboratory Test | Key Finding in wAIHA | Example LOINC Code | OMOP Concept ID |
|---|---|---|---|
| Hemoglobin | Decreased | 718-7 | 3000963 |
| Spherocytes | Present/Increased | 781-5 | 3023091 |
| Reticulocytes | Increased | 787-2 | 3013650 |
| Indirect Bilirubin | Increased | 1970-3 | 3022192 |
| Haptoglobin | Decreased | 4323-5 | 3006923 |
| Direct Antiglobulin Test (DAT) | Positive (IgG) | 797-1 | 3019183 |
By using these standard codes, we move beyond messy text searches for "Coombs test" or "DAT." This precision is what allows us to transform a clinical definition into a reproducible, executable query-the very foundation of building a reliable research cohort in the OMOP Common Data Model.
Mastering the Vocabularies for WAIHA Research
To find the right patients for a warm autoimmune hemolytic anemia study, you have to speak their language-the digital language of healthcare data. Building a reliable patient cohort inside a framework like the OMOP Common Data Model is all about knowing which codes and terminologies to use. Each vocabulary tells a different part of the patient's story.
Think of it as detective work. A single piece of evidence, like one diagnosis code, is rarely enough to close a case. You'd never rely on that alone. Instead, you need to triangulate evidence from different sources-diagnoses, lab tests, medications-to build a watertight profile of a patient who genuinely has WAIHA.
The Four Essential Vocabularies
When you dig into the data for WAIHA, you'll be working primarily with four standard vocabularies. Getting a feel for how each one works is the first step toward building a phenotyping algorithm you can actually trust.
- SNOMED CT (Systematized Nomenclature of Medicine - Clinical Terms): This is your clinical truth. SNOMED CT is structured like a family tree, with incredible detail that lets you distinguish between primary WAIHA, secondary forms, and other specific subtypes. It offers a level of clinical granularity you just can't get anywhere else.
- ICD-10-CM (International Classification of Diseases, Tenth Revision, Clinical Modification): Think of this as the language of billing. It’s absolutely essential, but its codes are often broad. A code like D59.1 ("Other autoimmune hemolytic anemias") lumps different conditions together, making it too blunt for precise clinical research.
- RxNorm: This is the universal translator for medications. It cuts through the confusion of brand names and generics to give you one standardized concept for each drug. This is how you can reliably find patients on corticosteroids or second-line treatments like rituximab.
- LOINC (Logical Observation Identifiers Names and Codes): As we've seen, LOINC is the key to unlocking lab data. It’s the vocabulary that lets you pinpoint the hard evidence-a positive DAT, a specific hemoglobin value-that confirms a WAIHA diagnosis.
The Classic Pitfall: Relying Only on ICD Codes
One of the most common mistakes I see is building a cohort based solely on ICD-10-CM codes. It’s tempting because it seems simple, but it's a flawed approach. Billing codes were never designed for clinical precision; they were designed to get claims paid.
Using only ICD codes means you'll likely pull in patients who don't truly have WAIHA, contaminating your cohort. For instance, the code might not differentiate warm AIHA from cold agglutinin disease, which can completely skew your analysis of treatment patterns or outcomes.
Tip: The gold standard is to anchor your cohort definition in SNOMED CT. Start there. Use its rich clinical hierarchy to build a comprehensive set of concepts for all the relevant WAIHA subtypes. Then, map the corresponding ICD codes back to these more precise clinical concepts. This approach ensures your research stands on a foundation of clinical accuracy, not just administrative convenience.
This technique is called semantic mapping for OMOP, and it's a non-negotiable skill for anyone doing high-quality, reproducible research with observational data.
A Smarter Way to Work with Vocabularies
Trying to manage local copies of all these vocabularies is a nightmare. They're massive, constantly updated, and keeping them in sync is a major infrastructure headache. This is where a service like OMOPHub becomes a lifesaver. It provides API access to the latest, curated OHDSI ATHENA vocabularies without the overhead.
Instead of wrestling with database maintenance, you can use a simple SDK to explore the terminologies programmatically. This lets you find the exact concepts you need, navigate their relationships to build out complete concept sets, and ensure your code is always pointing to the most current standards. For a look at the technical side, check out the OMOPHub documentation.
Working this way doesn't just save you time; it makes your research more transparent and trustworthy. By defining your cohort programmatically, you create a clear, executable recipe that anyone can follow, which is the cornerstone of reproducible science.
Practical Tutorial: Building a WAIHA Cohort with OMOPHub
Alright, let's move from theory to practice. It's one thing to understand the concepts behind warm autoimmune hemolytic anemia (WAIHA), but it's another to actually find these patients in your data. This is where we roll up our sleeves and write some code.
I'll walk you through a practical, hands-on tutorial for building a WAIHA patient cohort using the OMOPHub SDKs for both Python and R. These aren't just abstract examples; they're actionable snippets you can adapt right away to find diagnosis codes, build out comprehensive concept sets, and pinpoint the exact lab tests and medications that define this condition.
Of course, before you can query the data, you have to get it into your database. For anyone working with OMOP, knowing how to import CSV into PostgreSQL is a fundamental skill that you'll use constantly.
Finding WAIHA Diagnosis Concepts
First things first: we need to find the specific diagnosis codes that represent WAIHA. Our goal is to locate the standard concepts for warm autoimmune hemolytic anemia within the SNOMED CT and ICD-10-CM vocabularies. The OMOPHub SDKs make this initial search incredibly simple.
Python Example using OMOPHub
import os
from omophub.client import Client

# Initialize the client with your API key
# Tip: It's a best practice to use environment variables for API keys.
# Learn more at: https://docs.omophub.com/authentication
client = Client(api_key=os.environ.get("OMOPHUB_API_KEY"))

# Search for the WAIHA concept
waiha_concepts = client.concepts.search(
  query="Warm autoimmune hemolytic anemia",
  vocabulary=["SNOMED", "ICD10CM"]
)

for concept in waiha_concepts:
  print(
      f"ID: {concept.concept_id}, "
      f"Name: {concept.concept_name}, "
      f"Vocab: {concept.vocabulary_id}"
  )
R Example using OMOPHub
library(omophub)

# Set your API key
# Tip: Avoid hardcoding secrets. Use environment variables instead.
# See the R SDK docs: https://docs.omophub.com/sdks/r/
Sys.setenv(OMOPHUB_API_KEY = "YOUR_API_KEY_HERE")

# Search for the WAIHA concept
waiha_concepts <- search_concepts(
  query = "Warm autoimmune hemolytic anemia",
  vocabulary = c("SNOMED", "ICD10CM")
)

# Print the results
print(waiha_concepts)
Running these scripts will give you the core concepts you need to get started, like SNOMED CT ID 418115009 and the corresponding ICD-10-CM code D59.1. You can find both the Python and R SDKs on GitHub: omophub-python and omophub-R.
Expanding the Concept Set
A single diagnosis code is a good start, but it's never the full picture. Patients might be coded with more specific, related diagnoses, and if you only look for the parent term, you'll miss them. A truly robust cohort definition requires us to find all related sub-conditions.
Tip: This is a crucial step. It’s what separates a quick-and-dirty query from a clinically sound cohort. By programmatically finding all descendant concepts, you transform a simple code lookup into a comprehensive set of inclusion criteria, dramatically improving your cohort's accuracy.
We can use the OMOPHub SDK to grab all the descendants of our primary SNOMED code. The Python SDK, which you can check out on the OMOPHub Python GitHub repository, makes this process straightforward.
As you can see from the repository, the library is designed to be easy to install and integrate, which is exactly what you want when you're focused on the data science, not the boilerplate code.
Identifying Key Lab Tests and Medications
Finally, a high-fidelity cohort needs more than just diagnosis codes. We need to find corroborating evidence from labs and medications to be confident in our patient population.
- Diagnostic Confirmation: We have to look for the Direct Antiglobulin Test (DAT/Coombs test). This is the cornerstone for confirming the autoimmune nature of the hemolysis. A quick search for "Direct antiglobulin test" in the LOINC vocabulary will give us the concepts we need.
- First-Line Therapy: The standard initial treatment for WAIHA is corticosteroids, with prednisone being the most common. We can search the RxNorm vocabulary to identify patients who have been prescribed this medication.
Here’s how you’d find the RxNorm concept for Prednisone.
Python Example using OMOPHub
# Find the RxNorm concept for Prednisone
# Tip: Specifying concept_class="Ingredient" is the most robust way
# to find a drug, as it abstracts away from specific brand names or forms.
prednisone_concepts = client.concepts.search(
  query="Prednisone",
  vocabulary=["RxNorm"],
  concept_class=["Ingredient"]
)

for concept in prednisone_concepts:
  print(
      f"ID: {concept.concept_id}, "
      f"Name: {concept.concept_name}, "
      f"Class: {concept.concept_class_id}"
  )
This simple query reliably finds the standard RxNorm ingredient concept. From there, you can trace it to all drug products containing prednisone, giving you a complete list for your analysis.
By combining these code-driven steps-finding the core diagnosis, expanding it to include related conditions, and then layering in key lab and medication data-we can build a verifiable and reproducible WAIHA cohort definition. For more examples and detailed instructions, the official OMOPHub documentation is an excellent resource.
Analyzing Treatment Pathways and Patient Outcomes
Once your cohort is defined, the real investigation can get underway. This is where the meticulous work of data engineering starts to pay off, translating clean data into clinically meaningful insights. With an OMOP dataset, you can move past simply identifying patients with warm autoimmune hemolytic anemia (wAIHA) and begin to understand their treatment journeys and ultimate outcomes.

The first step is often mapping out the common treatment pathways. Clinical management for wAIHA is typically tiered, beginning with first-line therapies and escalating to more potent second-line options if the initial approach doesn't work. The OMOP Common Data Model gives us the tools to track these patient journeys with remarkable precision.
Mapping First- and Second-Line Therapies
For wAIHA, the go-to first-line treatment is corticosteroids, most commonly prednisone. These drugs work by tamping down the immune system to stop the destruction of red blood cells. To find these patients, you'd query the DRUG_EXPOSURE table for the relevant RxNorm codes.
But what happens next? A significant number of patients either don't respond well enough or end up relapsing. This is when clinicians turn to second-line treatments, which often include:
- Rituximab: A biologic drug designed to target the B cells that churn out the destructive autoantibodies.
- Splenectomy: The surgical removal of the spleen, which is a major site where antibody-coated red blood cells are cleared from circulation.
- Other Immunosuppressants: In tough, refractory cases, drugs like cyclophosphamide or azathioprine might be brought in.
To follow these paths, you need to build temporal queries. For instance, you could identify a group of wAIHA patients who started on prednisone and then, within a certain window, received their first dose of rituximab. This kind of analysis lets you quantify how often treatment is escalated and spot common patterns in the patient experience.
Tip: A well-structured OMOP dataset allows you to model the entire patient journey. You can calculate the time from diagnosis to the start of first-line therapy, measure how long that treatment lasts, and pinpoint the moment a patient is switched to a second-line option. It gives you a clear, data-driven picture of real-world clinical practice.
Structuring an Outcomes Analysis
With the treatment pathways mapped out, the focus naturally shifts to outcomes. Here, we're comparing the effectiveness of different therapies, tracking key clinical metrics over time, and trying to identify what predicts a relapse or treatment failure.
The stakes are incredibly high. The clinical burden is significant, with a reported 11% mortality rate directly linked to aggressive hemolysis. What's more, surveys of hematologists reveal a troubling reality: nearly 50% of patients are thought to be sub-optimally managed, and only 25% manage to keep their hemoglobin levels above 10 g/dL. You can explore the epidemiological forecast for wAIHA on DelveInsight for a deeper look.
To build a meaningful outcomes study, you should frame your analysis around concrete questions, such as:
- Treatment Effectiveness: Do patients receiving rituximab as a second-line therapy achieve longer-lasting remissions compared to those who have a splenectomy?
- Relapse Prediction: Are there baseline characteristics-like the initial severity of anemia or specific lab values-that can predict which patients are likely to fail corticosteroid therapy?
- Safety Profiles: What is the rate of serious infections among patients treated with powerful immunosuppressants compared to those on other therapies?
Answering these questions means linking drug exposure data from one table to outcomes recorded in others, like the MEASUREMENT table for lab results and the CONDITION_OCCURRENCE table for new diagnoses. This is the crucial step where all the data preparation comes together to generate the real-world evidence that can truly guide and improve clinical decision-making.
Frequently Asked Questions
What Is the Most Reliable Way to Identify WAIHA Patients in EHR Data Using OMOP?
The best approach is to build a high-fidelity patient profile by combining data from multiple domains. You can't just rely on one piece of information.
Start by creating a solid concept set with all the relevant SNOMED CT and ICD-10-CM codes for warm autoimmune hemolytic anemia. But that's just the first step.
Next, you need to find corroborating evidence in the MEASUREMENT table. The absolute key here is a positive Direct Antiglobulin Test (DAT/Coombs test), which you can pinpoint using its LOINC code. To really sharpen your cohort definition, you can add other classic lab signals of anemia (low hemoglobin) and hemolysis (like elevated LDH). And finally, make sure to explicitly exclude anyone with codes for cold AIHA to keep your cohort clean.
A tool like OMOPHub is built for this kind of work, letting you programmatically assemble these complex concept sets. For a deep dive into the available tools, you can check out the OMOPHub R SDK on GitHub.
Why Can I Not Just Use ICD-10-CM Codes for My WAIHA Cohort?
This is a really common question and a major pitfall. Relying solely on ICD-10-CM codes like D59.1 is tempting, but it will lead to trouble. These codes were designed for billing, not for detailed clinical research, and they often lack the granularity you need.
The problem is that billing codes can lump different conditions together, which is a recipe for misclassifying patients.
SNOMED CT, on the other hand, offers a much deeper clinical hierarchy. It lets you get specific enough to distinguish between primary and secondary wAIHA, for instance. A best-practice approach is to always anchor your cohort definition in SNOMED CT and then map the relevant ICD codes to those more precise clinical concepts during your ETL pipeline.
How Does OMOPHub Solve Vocabulary Updates for My Research?
Anyone who has worked with these datasets knows that medical vocabularies like SNOMED and LOINC are constantly being updated. This creates a huge maintenance headache for research teams. Keeping a local vocabulary database current is a persistent technical challenge that can easily bog down a project.
Tip: OMOPHub takes that entire problem off your plate. It provides direct API access to the very latest OHDSI ATHENA vocabulary releases as soon as they're available. This means you don't have to manage any local updates yourself, and your code will always run against the most current, standardized concepts. It ensures your research is reproducible and built on the right foundation, all without any manual intervention.
You can find a lot more detail in the official OMOPHub documentation.
OMOPHub eliminates the infrastructure burden of vocabulary databases so healthcare data teams can build reliable analytics and ship products faster. Get instant API access to the latest OHDSI ATHENA vocabularies and start building your cohort today at https://omophub.com.


