A Practical Guide to the OMOP Data Model in Healthcare
The OMOP Common Data Model is essentially a universal translator for the chaotic world of healthcare data. It takes wildly different information from sources like electronic health records (EHRs), insurance claims, and patient registries and reshapes it into a single, coherent format.
This common structure is the key that unlocks our ability to conduct reliable, large-scale observational research that spans organizations, health systems, and even entire countries.
Why the OMOP Data Model Matters
Let's be honest: healthcare data is a mess. Every hospital, clinic, and insurer has its own way of recording patient information, using unique codes, proprietary formats, and conflicting terminologies. This creates a digital "Tower of Babel" where crucial health insights are trapped in isolated systems.
Trying to run a single analytical study across these fragmented datasets is a nightmare. It requires a monumental, bespoke effort for every single research question, a process that is both inefficient and completely unsustainable.
This is precisely the challenge the OMOP data model was built to conquer. Think of it as a universal power adapter for health data. Just as a travel adapter lets you plug your phone into any outlet in any country, OMOP allows disparate health datasets to connect to a standardized analytical framework. It provides a common structure and a shared language-a standardized vocabulary-so that a "myocardial infarction" in one system means the exact same thing as a "heart attack" in another.
Solving the Data Silo Problem
By mapping raw, source-specific data into this common format, organizations finally begin to tear down the walls between their data silos. This unlocks a tremendous amount of potential and delivers tangible benefits to everyone involved.
The following table breaks down how different teams win when an organization adopts OMOP.
Key Benefits of Adopting the OMOP Data Model
| Stakeholder Role | Primary Benefit |
|---|---|
| Data Engineers | A clear, predictable target structure for complex ETL pipelines, which cuts down on guesswork and speeds up development. |
| Researchers | The ability to run the same analytical code across multiple datasets from different institutions, leading to reproducible science and much greater statistical power. |
| AI Teams | A clean, standardized foundation for training machine learning models on diverse patient populations without re-engineering the data ingestion process for each new source. |
This standardized approach makes it possible to build and deploy analytical tools and methods that work consistently, no matter where the data originated.
This collaborative spirit is driven by the Observational Health Data Sciences and Informatics (OHDSI) community. OHDSI is a global, open-science network dedicated to one mission: improving health by empowering large-scale analytics.
The OMOP Common Data Model got its start back in 2008, funded by the US Food and Drug Administration to create better statistical methods for drug safety surveillance. Its adoption truly took off after the OHDSI initiative embraced it in 2014. Today, the network includes over 2000 collaborators across 74 countries, representing standardized health data for approximately 800 million patients. Discover more insights about the model's global impact and how it's bringing together payers, life sciences, and providers.
Understanding the Core OMOP Data Model Tables
At its heart, the OMOP data model is designed to tell a patient's story. Instead of a messy web of disconnected data points, it structures information into a logical, chronological narrative. Think of the core tables as chapters in a book-each one reveals a different part of a person’s healthcare journey.
This clean, intuitive structure allows anyone, from a data engineer to a clinical researcher, to quickly locate the right information. Once you grasp how these tables connect, you can start asking-and answering-incredibly complex questions about entire patient populations.
The diagram below shows how OMOP acts as a universal adapter, taking in messy, disparate data sources and transforming them into a single, standardized format ready for analysis.
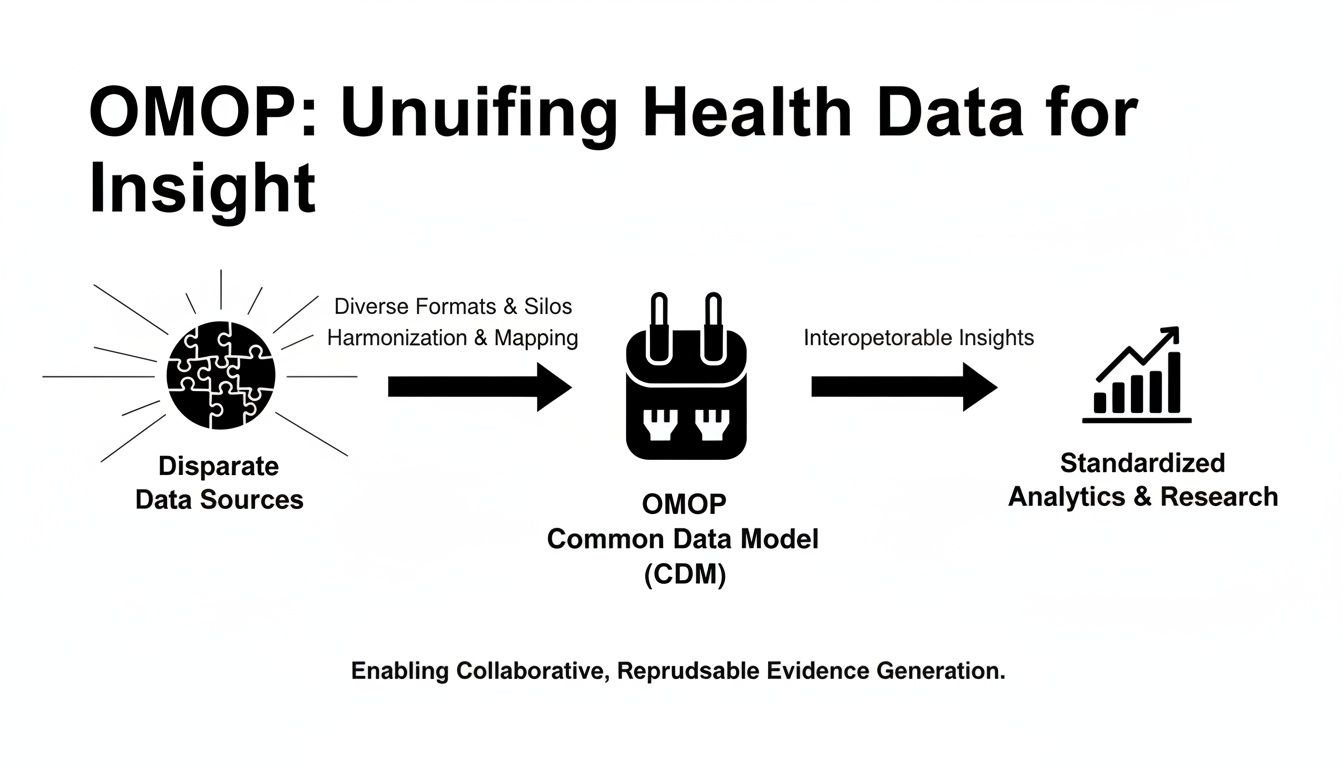
This process is what breaks down the data silos that have long plagued healthcare research, paving the way for consistent and scalable studies that just wouldn't be possible otherwise.
The Foundation: Who, Where, and When
Every patient story needs a main character, a setting, and a timeline. In OMOP, a couple of core tables handle this fundamental context.
-
PERSON Table: This is the 'who.' It’s the master list, holding just one record for each unique individual in the dataset. It stores basic demographics like year of birth, gender, and race. The person_id serves as the universal key that links this individual to every other event in the database.
-
VISIT_OCCURRENCE Table: This table answers 'where and when.' It records every single encounter a patient has with the healthcare system, whether that's a routine doctor's appointment, an emergency room visit, or a multi-day hospital stay. Each record has a unique visit_occurrence_id and links directly back to the patient via the person_id.
Together, these two tables form the very backbone of the model. They establish the essential context for all the clinical events that follow.
Documenting What Happened: The Clinical Event Tables
With the person and visit established, the next set of tables gets down to the 'what'-the specific diagnoses, treatments, and procedures that make up a patient's clinical history.
A core principle of OMOP is that every clinical event table must contain a foreign key back to the PERSON table and, when it makes sense, to the VISIT_OCCURRENCE table. This simple relational rule ensures every recorded event can be traced back to a specific individual and a specific encounter.
Let’s walk through the most important event tables.
-
CONDITION_OCCURRENCE: This is where you’ll find all patient diagnoses, from chronic illnesses to acute infections. Each row represents a specific condition like 'Type 2 diabetes' or 'acute bronchitis,' tied to a patient and, usually, to the visit when it was first diagnosed.
-
DRUG_EXPOSURE: Here, you'll find a record of every medication prescribed or administered. The table captures the drug's name, dosage, and exposure dates, creating a complete medication history for each person.
-
PROCEDURE_OCCURRENCE: This table tracks all medical procedures performed on a patient. It covers everything from major surgeries like a 'coronary artery bypass graft' down to routine actions like a 'vaccination.'
These three tables are the workhorses for many observational studies, giving researchers the raw data to track disease progression, analyze treatment patterns, and measure patient outcomes.
Capturing the Finer Details: Measurements and Observations
Of course, not all health data fits neatly into a diagnosis, drug, or procedure. Two other critical tables, MEASUREMENT and OBSERVATION, are designed to capture the rest of the story. Their names sound similar, but their jobs are quite distinct.
The MEASUREMENT table is specifically for structured, quantitative data-things that have a numeric value and a unit. This includes:
- Lab test results (e.g., Hemoglobin A1c of 7.5%)
- Vital signs (e.g., Systolic blood pressure of 120 mmHg)
- Scores from clinical assessments (e.g., a pain score of 8 out of 10)
The OBSERVATION table, on the other hand, is a more flexible, general-purpose bucket for qualitative data or information that doesn't have a clear home elsewhere. Think of it as the place for:
- Social and lifestyle details (e.g., smoking status, alcohol use)
- Family history of disease
- Answers from surveys or patient-reported outcomes
Pro Tip: A simple way to tell them apart is to ask: "Does this data point have a number and a unit?" If yes, it almost certainly belongs in the MEASUREMENT table. If not, it's probably an OBSERVATION.
For example, a query to find all patients with recent high blood pressure readings would target the MEASUREMENT table. Here's what that might look like conceptually:
-- Find patients with recent systolic blood pressure readings over 140 mmHg
SELECT
    m.person_id,
    m.measurement_date,
    m.value_as_number
FROM
    measurement m
JOIN
    concept c ON m.measurement_concept_id = c.concept_id
WHERE
    c.concept_name = 'Systolic blood pressure'
    AND m.value_as_number > 140
    AND m.measurement_date >= '2023-01-01';
This logical structure ensures that every piece of a patient's health story has a proper home, making the data far more accessible and ready for powerful analysis. For a deeper dive, you can find the detailed specifications for all these tables in the official OHDSI documentation on the OMOP Common Data Model.
The Power of Standardized Vocabularies
If the OMOP tables are the grammar of a patient's story, then the standardized vocabularies are the dictionary. They give every single word a precise, universal meaning. Without this dictionary, the whole system would be useless-just a digital "Tower of Babel." These vocabularies are the real engine of the OMOP data model, translating thousands of disconnected local codes into one unified language for analysis.
Think about trying to compare patient data from two different hospitals. One uses ICD-10 codes for diagnoses, while the other relies on some homegrown, internal system. A researcher looking for all patients with "Type 2 diabetes" would have to become a detective, hunting down every possible code for that one condition in each system. It’s an impossible task at scale.
Standardized vocabularies fix this by acting as a universal translator. Every distinct medical idea-a specific diagnosis, a particular medication, a lab test, a procedure-gets assigned a single, unambiguous number: a concept_id.

This concept_id is the secret sauce. When raw data is loaded into an OMOP database, each local code is mapped to its corresponding standard concept. So, an ICD-10 code like E11.9 and an internal hospital code like DMII-uncomp both get translated to the exact same standard concept for "Type 2 diabetes mellitus without complication."
Key Vocabularies in the OMOP Data Model
The OHDSI community carefully curates a set of standard vocabularies to cover all the essential clinical domains. The big three you'll always run into are:
- SNOMED CT: The heavyweight champion for conditions, procedures, and observations. It's a massive, hierarchically organized vocabulary that captures an incredible amount of clinical detail.
- RxNorm: The gold standard for medications. It brilliantly normalizes everything about drugs-names, ingredients, strengths, and dose forms-ensuring "Tylenol 500mg" and "Acetaminophen 500mg" are understood as the same active ingredient.
- LOINC: The go-to vocabulary for lab tests and measurements. It gives you specific codes for thousands of different tests, like "Hemoglobin A1c/Hemoglobin.total in Blood."
This consistent terminology is what lets a researcher write a single query and run it across hundreds of databases worldwide. This power has fueled a massive surge in the model's adoption. Since OHDSI adopted the OMOP CDM in 2014, literature on the model has exploded, doubling from 2019 to 2020 alone. This growth comes directly from OMOP's ability to harmonize messy, disparate codes into a common format, opening the door for global research that was once unthinkable. To get a sense of this impact, you can explore the research on its global expansion and methodology.
The Challenge of Vocabulary Management
As powerful as they are, managing these vocabularies is a huge operational headache. They are enormous, containing millions of concepts and relationships, and they get updated all the time.
Traditionally, every team had to download, host, and maintain their own dedicated vocabulary database server. This meant constant upkeep, version tracking, and infrastructure babysitting-a major bottleneck for both data pipeline development and actual analysis.
The complexity of keeping vocabularies current cannot be understated. A change in a single mapping or the retirement of a concept can have cascading effects on analytical results, making version control absolutely critical for reproducible science.
Thankfully, modern tooling has completely changed this game. Platforms like OMOPHub give you instant, programmatic access to the latest OHDSI vocabularies through a simple REST API. This completely removes the need for local database infrastructure, freeing up your data engineers to focus on building pipelines, not managing servers. For more on how this works, you can read about the importance of vocabulary versioning and release cycles.
Programmatic Vocabulary Access in Practice
Instead of writing complicated SQL joins against a local database just to look up a concept, developers can now do it with a few lines of code. This dramatically speeds up both the initial ETL mapping process and the development of analytical tools.
For instance, finding the standard concept for "aspirin" can be done with a simple Python snippet using an SDK that talks to an API.
# Import the SDK client
from omophub import OMOPHub

# Initialize client (uses OMOPHUB_API_KEY env variable, or pass api_key="...")
client = OMOPHub()

# Search for concepts related to 'aspirin'
try:
    response = client.search.basic("aspirin", vocabulary_ids=["RxNorm"], domain_ids=["Drug"])

    # Print the concept ID and name for the first result
    if response.concepts:
        top_result = response.concepts[0]
        print(f"Concept ID: {top_result.concept_id}, Name: {top_result.concept_name}")
except Exception as e:
    print(f"An error occurred: {e}")

# Expected Output: Concept ID: 1112807, Name: Aspirin
This code isn't just cleaner and easier to maintain than a multi-table SQL query; it also guarantees your team is always working with the most up-to-date, centrally managed vocabulary. To see more examples, you can find detailed guides in the OMOPHub SDK documentation. By offloading the vocabulary burden, teams can build, test, and deploy their data pipelines and applications much, much faster.
A Practical Approach To Your ETL Process
Getting raw, messy source data into the clean, structured OMOP data model format is a journey we call the Extract, Transform, and Load (ETL) process. This is where the theoretical power of data standardization meets the often-unpredictable reality of real-world data. A successful ETL project isn’t just a technical exercise; it requires a methodical, step-by-step approach to ensure the final dataset is accurate, reliable, and truly ready for analysis.
Think of it less like moving files from one folder to another and more like translating a complex novel. You have to first deeply understand the original text (Extract), then meticulously convert its meaning and nuance (Transform), and finally publish the new version in a universally understood format (Load). It’s an art and a science.
Analyzing Your Source Data
The first, and arguably most critical, step is getting your hands dirty with the source data. Before a single line of ETL code is written, you need to develop an intimate understanding of what you're working with. This means profiling the data to map out its structure, content, and-most importantly-its quirks and quality issues.
During this discovery phase, you’ll be asking some fundamental questions:
- What local, non-standard coding systems are we dealing with?
- Are there crucial details buried in free-text fields that need to be parsed?
- How are dates and times formatted, and are they consistent?
- What are the most common data quality problems, like missing values or completely illogical entries?
Thankfully, you don't have to start from scratch. The OHDSI community offers fantastic open-source tools to help. White Rabbit is designed to scan your source database and generate a comprehensive profile, giving you a clear picture of every table, column, and its contents. This initial scan is the foundation for everything that follows. You can learn more by visiting the official White Rabbit documentation.
Designing The Mapping And Transformation
Once you have a firm grasp of your source data, you can start architecting the mapping specification. This document is the blueprint for your entire ETL. It details precisely how each source column will be transformed and where it will ultimately land in the target OMOP tables.
A powerful tool for this phase is Rabbit in a Hat. It takes the output from White Rabbit and provides an interactive interface where you can visually map source columns to their OMOP destinations and document all the transformation logic along the way.
This is also where vocabulary mapping takes center stage. You’ll need to translate every local code-like an internal drug formulary ID-to a standard OHDSI concept, such as an RxNorm concept ID. This can be a monumental task, but it’s the absolute key to creating interoperable, research-grade data.
A French primary care facility provides a striking real-world example of this process. Researchers converted 20 years of EHR data from 18,395 patients into the OMOP CDM. The effort identified 17 distinct local vocabularies and required 9,432 precise mappings to standard OHDSI vocabularies, highlighting just how intensive-and valuable-this mapping work truly is. You can read the full research about this extensive ETL project to appreciate the scale.
Data Mapping Approaches Compared
The method you choose for vocabulary mapping will have a massive impact on your project's timeline, budget, and scalability. While traditional methods using spreadsheets and local database instances have been common, they are quickly being outpaced by more dynamic, API-driven approaches.
Here’s a look at how the two approaches stack up.
| Attribute | Manual Mapping (Spreadsheets/Local DB) | API-Driven Mapping (OMOPHub) |
|---|---|---|
| Speed | Slow; requires tedious manual lookups and cross-referencing. | Fast; programmatic access delivers sub-50ms responses. |
| Maintenance | High; demands manual vocabulary updates and version tracking. | Zero; versions are centrally managed and always current. |
| Scalability | Poor; difficult to integrate into automated, production-level pipelines. | Excellent; designed to scale easily within any ETL workflow. |
| Accuracy | Prone to human error, typos, and outdated mapping files. | High; leverages the latest official vocabulary releases. |
As you can see, the differences are stark. Using an API-driven service like OMOPHub completely removes the infrastructure burden of downloading, hosting, and updating the vocabularies yourself. Your team can programmatically search and map concepts in minutes, not days, which radically accelerates the development cycle.
To explore how this can simplify your workflow, check out the documentation for our SDK. You can also find updates on new features that support ETL processes in the OMOPHub SDK v1.3.0 release notes.
Ensuring Data Quality and Validation
Getting your raw data successfully transformed into the OMOP Common Data Model is a huge milestone, but it's really just the beginning of the journey. The real power of an OMOP database comes from knowing you can trust the data inside it, and that trust is built on a foundation of rigorous data quality assurance.
If you don't have a systematic way to validate your data, tiny errors in your ETL process can sneak in, quietly corrupting your analytical results and leading you to draw the wrong conclusions.
This is precisely why data quality can't be a final checkbox you tick off at the end of a project. It has to be a continuous, living part of your data governance strategy. When a researcher queries a validated OMOP dataset, they have confidence that their findings are grounded in a faithful representation of the patient journey, which is what makes their work solid, reproducible, and reliable.
Automating Quality Checks with the DQD
Let's be realistic: no one can manually check millions or billions of records for subtle mistakes. It's simply not possible. That’s why the OHDSI community created a brilliant solution: the Data Quality Dashboard (DQD). The DQD is an open-source R package that automates this entire process, running thousands of pre-written data quality checks against your OMOP database.
Think of it as the "trust but verify" engine for your data. It systematically sweeps through every table and column, making sure everything conforms to the OMOP CDM standards and flagging anything that looks suspicious.
The checks performed by the DQD generally fall into three buckets:
- Conformance: Does your database schema actually match the official OMOP CDM specification? Are columns using the right data types?
- Completeness: Are critical fields unexpectedly empty? For instance, every single row in the
DRUG_EXPOSUREtable absolutely must have aperson_id. - Plausibility: Does the data actually make sense? This is where the DQD really proves its worth, catching the kind of clinical and chronological absurdities that would otherwise slip right through.
A core tenet in the OMOP world is that validation isn't a one-and-done task. It's a routine you should run every single time your data is refreshed or your ETL logic changes. This is how you maintain data integrity over the long haul.
Understanding Plausibility Checks
Plausibility checks are where the magic happens. They’re designed to catch data entry typos or ETL bugs that create patient records that are just plain illogical. They enforce the kind of common-sense rules that must hold true in the real world.
A classic example is checking that a person's birth date comes before any of their clinical visits or procedures. It sounds obvious, but you'd be surprised what you find. No one sees a doctor before they're born.
Here are a few other examples of what these checks look for:
- Making sure a hospital visit's
end_datedoesn't come before itsstart_date. - Confirming that a person's death date, if it exists, is the very last event in their record.
- Flagging biologically impossible values, like a negative height or a body temperature of 200°C.
These checks are absolutely essential for creating a high-fidelity dataset that truly mirrors clinical reality. To give you a feel for how this works, here's a conceptual SQL query that looks for a basic chronological error.
-- Conceptual check for visits occurring before a person's birth year
SELECT
  v.visit_occurrence_id,
  v.person_id,
  p.year_of_birth,
  EXTRACT(YEAR FROM v.visit_start_date) AS visit_year
FROM
  visit_occurrence v
JOIN
  person p ON v.person_id = p.person_id
WHERE
  EXTRACT(YEAR FROM v.visit_start_date) < p.year_of_birth;
This simple query would immediately surface any visits recorded in a year before the patient was even born-a clear data quality red flag. The DQD automates thousands of checks just like this, producing a comprehensive report that helps data teams hunt down and fix problems, whether they stem from the source data or from a bug in the ETL code. For a deeper dive, you can find a wealth of resources on the official OHDSI Data Quality Dashboard page.
Advanced Applications and Enterprise Governance
Once your data is cleaned up and sitting nicely in the OMOP CDM, you can start asking much bigger questions. The real power of OMOP isn't just in organizing data-it's about creating a launchpad for sophisticated predictive models and joining the global research community. But as you scale up from a single study to an enterprise-wide asset, you have to get serious about performance and governance.
When you're dealing with datasets that have millions or even billions of rows, database performance can grind everything to a halt. A standard relational database, even a good one, will start to buckle under the strain of complex queries. This is where smart performance tuning becomes absolutely essential.
Performance Tuning for Scale
Getting a massive OMOP database to return queries in seconds instead of hours isn't magic; it's just good data engineering. Here are the core strategies that make a real difference:
- Strategic Indexing: Don't just rely on the default primary key indexes. You need to create composite indexes on the foreign keys you use all the time, like
person_idandvisit_occurrence_id. Also, add indexes to frequently filtered columns, especially date fields likecondition_start_date. - Database Partitioning: The
MEASUREMENTandDRUG_EXPOSUREtables can become monstrously large. A great tactic is to split them into smaller, more manageable pieces, usually by year. This way, when a researcher runs a query for a specific time frame, the database only has to scan a fraction of the total data. - Materialized Views: If you find yourself running the same complex, resource-intensive queries over and over-like building a specific patient cohort for analysis-don't reinvent the wheel every time. Pre-calculate the results and store them in a materialized view. It's like having the answer ready before the question is even asked.
Fueling AI and Machine Learning
The clean, standardized structure of the OMOP CDM is a gift to any data science team. It provides a reliable foundation for training machine learning models. Because concepts are harmonized, a predictive model trained on one hospital's OMOP dataset can be more easily tested and validated on another's. This is a huge step toward building AI that actually works in the real world, not just on a single, pristine dataset.
A well-governed OMOP dataset is not just a repository of past events; it's a predictive asset. The structured format allows AI teams to efficiently generate features for tasks like predicting disease onset, identifying at-risk patients, or optimizing treatment pathways.
The format of the OMOP tables naturally simplifies the feature engineering process. For instance, a simple Python script can pull data directly into a patient-feature matrix, ready for a prediction task.
import pandas as pd
from sqlalchemy import create_engine

# Tip: Use environment variables for database credentials in production.
# Assume 'db_connection_string' is a valid SQLAlchemy connection string.
# engine = create_engine(db_connection_string)

# Example query to generate features for an ML model
query = """
SELECT
    de.person_id,
    c.concept_name AS drug_name,
    COUNT(*) AS exposure_count
FROM
    drug_exposure de
JOIN
    concept c ON de.drug_concept_id = c.concept_id
WHERE
    c.concept_name IN ('Lisinopril', 'Metformin')
GROUP BY
    de.person_id, c.concept_name;
"""

# This creates a feature set for ML models
# In a real scenario, you would execute this with your database connection.
# patient_features = pd.read_sql(query, engine)
# print(patient_features.head())
Enterprise Governance and Compliance
As your use of OMOP grows, robust data governance becomes non-negotiable. You're dealing with sensitive patient information, so protecting privacy and complying with regulations like HIPAA and GDPR is paramount.
Here are the key practices to put in place:
- De-identification: This goes beyond simply removing names and addresses. You need to apply techniques like date-shifting to obscure exact dates of birth or admission, making it computationally difficult to re-identify an individual.
- Audit Trails: You must have an immutable log of who accessed what data, and when. Enterprise platforms like OMOPHub build this in from the ground up, giving you a clear audit trail without any extra effort.
- Federated Learning: This is a game-changer for collaborative research. It allows different institutions to train a shared model without ever moving their sensitive patient data outside their own firewalls. The model learns from everyone's data, but the data itself stays put, maximizing both insight and privacy.
From building economic models to training the next generation of clinical AI, these applications show what the OMOP data model can do when it's backed by a solid technical and governance framework. For those interested in this area, you can learn more about how the OMOP CDM is applied in health economics and outcomes research.
Common Questions We Hear About the OMOP Data Model
Even with a solid plan, moving to the OMOP data model brings up plenty of real-world questions. Let's tackle some of the most common ones that teams run into when they get their hands dirty with an implementation.
OMOP CDM vs. FHIR: Aren't They the Same Thing?
This is a frequent point of confusion, but they're really two sides of the same coin. OMOP CDM and FHIR are designed to be complementary, not competitive.
Think of FHIR (Fast Healthcare Interoperability Resources) as the plumbing for real-time healthcare data. It’s built for exchanging information between live systems-like when a lab system needs to send a patient’s latest results directly to their electronic health record. It’s transactional and immediate.
The OMOP CDM, on the other hand, is the research library. It’s built for large-scale analytics, where you need to look at trends across huge populations over long periods. It's not designed for that moment-to-moment data exchange.
Here's a simple analogy: FHIR is like the text message telling your doctor your appointment is confirmed. OMOP is the massive, organized database where analysts can study appointment patterns for millions of patients over a decade.
Where Do I Put Data That Doesn't Fit?
So, what do you do with information that just doesn't seem to have a home in one of the standard tables? For most qualitative or unstructured bits of information, the OBSERVATION table is your go-to destination. It’s the flexible catch-all for a reason.
But sometimes you have truly unique, source-specific data that you can’t lose. In those cases, the model is extensible. You can absolutely create custom tables to house this information.
Pro Tip: If you create custom tables, a best practice is to always include a person_id column that acts as a foreign key back to the PERSON table. This ensures your custom data remains connected to the patient's record. OHDSI offers excellent guidance on this, which you can find in their official Common Data Model resource pages.
Is OMOP a Good Fit for Commercial Products?
Without a doubt. Building a commercial healthcare product on top of the OMOP data model is a smart move, especially for tools focused on analytics, generating real-world evidence, or clinical decision support.
When you standardize your backend data to OMOP, you give your product team a massive head start. It means they can build scalable, interoperable applications that can plug into new and different data sources without a ton of custom engineering for each one.
What Are the Biggest Hurdles to Getting Started?
Let's be honest: the initial conversion can be tough. The single biggest challenge, time and again, is the vocabulary mapping. Taking thousands of local, source-specific codes for drugs, conditions, and procedures and translating them into standard OHDSI concepts is a heavy lift. It requires serious clinical and domain expertise.
The second major hurdle is often the quality of the source data itself. You'll inevitably run into inconsistencies and gaps that need to be addressed before the data can be reliably mapped.
OMOPHub eliminates the vocabulary infrastructure burden, giving your team instant API access to the latest OHDSI vocabularies. Accelerate your ETL, mapping, and AI workflows by visiting https://omophub.com.


