Unlocking Insights with Observational Research and Real-World Data
Imagine you're a detective arriving at a scene. You can't change what happened; your job is to observe the evidence, interview witnesses, and piece together the story as it unfolded. That’s the essence of observational research in a nutshell. Researchers act as investigators, carefully studying people and variables of interest in their natural setting without stepping in to assign treatments.
This approach is the backbone of so much of what we know about health and disease on a massive scale.
What Is Observational Research in Healthcare

In a healthcare setting, observational research lets us explore the real-world effects of a risk factor, a new diagnostic test, or a specific treatment without telling anyone what to do. We simply watch what happens to people who are-or are not-exposed to these factors as part of their everyday lives.
It’s a powerful method, especially for questions where controlled experiments just aren't possible or ethical. You can't ethically force a group of people to start smoking to see if it causes cancer. Instead, we can observe groups of people who already smoke and compare their health outcomes to those who don't.
While incredibly insightful, observational studies differ significantly from the "gold standard" of experimental design, the Randomized Controlled Trial (RCT). Here's a quick breakdown of how they compare.
Observational Research vs Randomized Controlled Trials (RCTs)
| Characteristic | Observational Research | Randomized Controlled Trial (RCT) |
|---|---|---|
| Intervention | Researchers observe outcomes without assigning any intervention. | Researchers assign an intervention or treatment to participants. |
| Control Group | A comparison group is selected based on existing characteristics. | Participants are randomly assigned to either a treatment or control group. |
| Setting | Typically conducted in real-world settings (e.g., hospitals, clinics). | Often conducted in highly controlled, specific clinical environments. |
| Causation | Can show association or correlation, but proving causation is difficult. | Stronger evidence for establishing a cause-and-effect relationship. |
| Ethical Concerns | Useful for studying potentially harmful exposures that can't be assigned. | Can be ethically impossible for certain research questions (e.g., studying toxins). |
| Generalizability | Findings are often more applicable to diverse, real-world populations. | Findings might not always translate perfectly to the general population. |
Both approaches have their place, and the best method really depends on the research question at hand. One isn't inherently "better" than the other; they're simply different tools for different jobs.
The Role of Standardization in Modern Research
One of the biggest historical headaches in observational research has been messy, inconsistent data. A diagnosis recorded in a London hospital might use entirely different codes and terms than one in a Tokyo clinic, making it nearly impossible to combine their data for a larger, more powerful study.
This is where data standardization has been a game-changer. By creating a common language for health data, we can finally break down those silos. This ecosystem relies on a few key components:
- OMOP Common Data Model (CDM): This provides a standard structure-a universal blueprint-for organizing and storing health data, no matter where it came from.
- Standard Vocabularies: Terminologies like SNOMED CT (for clinical findings), LOINC (for lab tests), and RxNorm (for medications) ensure everyone is describing the same concept in the same way.
By transforming disparate datasets into a common format, the OMOP CDM enables large-scale, collaborative research that was previously impossible. It allows analysts to write a single query that can run on data from around the world.
Accelerating Discovery with Modern Tools
Getting all that messy, real-world data into a clean, standardized format can be a huge technical lift. It's often the most time-consuming part of a research project. That’s where platforms like OMOPHub come in. They are designed to handle the heavy lifting by providing API access to standardized vocabularies, freeing up researchers to focus on analysis and discovery, not data plumbing.
This ability to quickly generate evidence is more than a convenience; it's a necessity. During public health crises, well-designed observational studies can produce findings with accuracy comparable to RCTs but in a fraction of the time. We saw just how critical this was during recent epidemics, where decision-makers needed reliable evidence from real-world settings-and they needed it fast. You can learn more about the effectiveness of this approach in crisis settings.
Understanding Common Observational Study Designs
Picking the right study design is a bit like choosing the right tool for a job. You wouldn't use a hammer to saw a board, and in research, each design is built to answer a specific kind of question. Your choice of design dictates how you gather data and, more importantly, what conclusions you can responsibly draw from it.
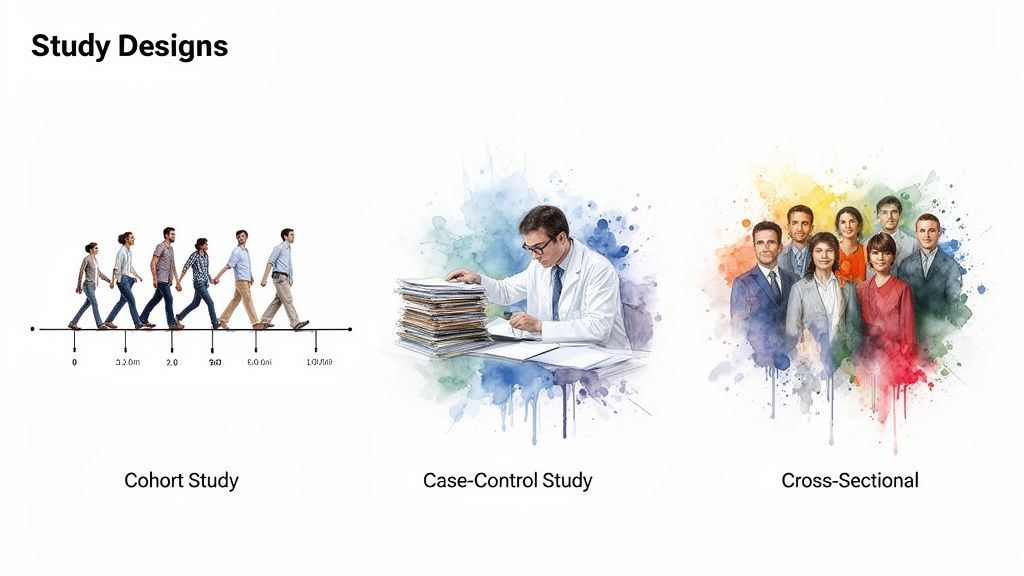
While there are countless variations out there, nearly all observational research is built on the foundation of three core designs: cohort, case-control, and cross-sectional studies. Getting a handle on their distinct strengths and limitations is the first real step toward designing a study that produces credible, impactful results.
Let’s dig into how each one works.
Cohort Studies: Following a Group Forward in Time
Think of a cohort study as filming a documentary. You pick a group of people-say, the entire graduating class of 2025-and follow them for the next 30 years. You’d record their careers, health habits, and major life events, periodically checking in to see who develops a specific condition, like hypertension.
You start with a group (the cohort), measure their exposures, and then follow them forward in time to see what happens. This prospective approach is incredibly powerful for identifying potential risk factors because you establish the exposure before the outcome ever appears. That timeline is crucial for making a strong argument about causality.
Key Takeaway: Cohort studies are forward-looking. They start with an exposure (e.g., a new medication) and follow a group over time to observe the development of an outcome (e.g., side effects).
- Strength: The gold standard for understanding the natural history of a disease and calculating incidence (the rate of new cases).
- Weakness: They can be incredibly time-consuming and expensive. If you're studying a rare disease, you might be waiting a very long time for enough cases to emerge.
- Healthcare Example: A classic cohort study might enroll thousands of healthy, middle-aged adults, track their diets for 20 years, and see which dietary patterns are associated with the development of cardiovascular disease.
Case-Control Studies: Working Backward from an Outcome
Now, imagine you’re a detective arriving at a crime scene. The event has already happened, and your job is to piece together what led to it by looking backward for clues. That’s the basic idea behind a case-control study.
This design is fundamentally retrospective. You begin by identifying people who already have the disease or condition you're interested in (the “cases”). Then, you find a comparable group of people who don't have it (the “controls”). The real work is looking back in time-through records or interviews-to see if a particular exposure was more common among the cases than the controls.
- Strength: Extremely efficient for studying rare diseases. You don't have to wait for the disease to occur; you start with the people who already have it.
- Weakness: The biggest pitfall is recall bias. Asking people to accurately remember exposures from years or even decades ago is notoriously unreliable.
- Healthcare Example: To investigate a rare cancer, researchers could identify 100 patients with the disease and find 200 similar individuals without it. They would then dig into medical histories to see if exposure to an industrial chemical was more frequent in the cancer group.
Cross-Sectional Studies: Capturing a Single Moment in Time
A cross-sectional study is like taking a snapshot of a huge crowd at one specific moment. It captures a freeze-frame of everything happening at that instant-who’s there, what they’re doing, and what characteristics they have, all at the same time.
With this design, researchers collect data from a population at a single point in time to measure both exposures and outcomes simultaneously. This gives you a great look at prevalence-the proportion of a population that has a condition at that moment.
- Strength: These studies are relatively fast, simple, and cheap to execute.
- Weakness: They can’t establish cause and effect. Since you measure everything at once, you can show that smoking and asthma coexist, but you can't prove that one caused the other.
- Healthcare Example: A national health survey asks thousands of adults about their current smoking habits and whether they have an asthma diagnosis. The data can reveal a strong association between the two but can't definitively say the smoking came first.
Working with Real-World Data Sources
Think of Real-World Data (RWD) as the raw material that powers every observational study. It’s the digital exhaust of healthcare-the data captured not for research, but as a byproduct of everyday patient care. This gives us a powerful, unfiltered window into how treatments work and diseases unfold in the real world, far from the controlled environment of a clinical trial.
But that raw authenticity comes with a serious catch. RWD is inherently chaotic. It’s a patchwork quilt of information collected by different systems, for different reasons, using different languages. This messy reality presents a major hurdle for researchers who need clean, consistent data to find reliable answers.
The Diverse and Messy World of RWD
The term "Real-World Data" is an umbrella for a huge variety of sources, and each one comes with its own unique set of pros and cons. Knowing what you're working with is the first step toward building a solid study.
Here are the heavy hitters:
- Electronic Health Records (EHRs): This is the treasure trove. EHRs hold the rich clinical details recorded during a patient visit-physician notes, lab results, diagnoses, and prescriptions. The catch? Much of this data can be unstructured and wildly inconsistent from one system to another.
- Insurance Claims Data: Generated for billing, claims data is fantastic for tracking diagnoses, procedures, and healthcare usage over long periods. But it lacks the "why"-the granular clinical details like lab values or the doctor's reasoning behind a treatment choice.
- Patient Registries: These are curated databases focused on a specific population, like patients with cancer or a rare disease. Registries offer high-quality, standardized data, but their scope is naturally limited to a specific condition.
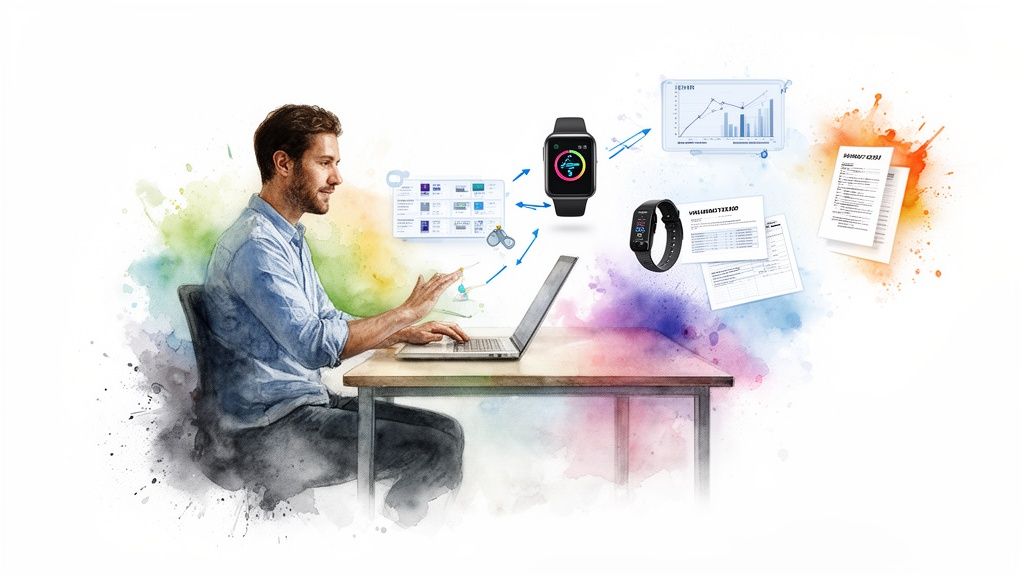
- Wearable Devices and Mobile Health Apps: Data from smartwatches and fitness trackers is opening up entirely new frontiers. We can now get continuous, real-time insights into a person's activity level, heart rate, and sleep patterns.
And when a study involves gathering spoken information through interviews or focus groups, turning that audio into usable information is critical. This is where effective qualitative research transcription becomes an essential part of the data pipeline.
The Standardization Imperative
The fundamental challenge with RWD is wrestling all that messy, fragmented information into a single, cohesive dataset that you can actually analyze. Trying to combine data from a Boston hospital's EHR with claims data from a California insurer without a common framework is a recipe for disaster.
This is where standardization becomes non-negotiable. The Observational Medical Outcomes Partnership (OMOP) Common Data Model (CDM) acts as a universal translator. It provides a standard structure for health data, ensuring that a "myocardial infarction" means the exact same thing everywhere.
The OMOP CDM works by mapping local source codes to a standard set of vocabularies, forcing everything into a unified format. This transformation is the linchpin that makes large-scale, multi-site observational research not just possible, but powerful.
Validating Findings on a Global Scale
Standardization does more than just tidy up your data; it gives you the power to see if your findings hold up across huge, diverse populations. A compelling result found in a single hospital’s dataset might just be a local fluke-a quirk of their patient demographics or clinical habits.
By using globally standardized data, researchers can put their hypotheses to the ultimate test across different countries and healthcare systems. Resources like the World Health Organization's Global Health Observatory (GHO) offer access to over 1,000 health indicators from 194 Member States. This, combined with data from initiatives like the Demographic and Health Surveys (DHS) program, helps researchers put their findings into a broader context. This is what separates a localized observation from a truly generalizable scientific insight.
How to Tackle Bias and Confounding
The real challenge in observational research isn't just getting the data; it’s making sure the story it tells you is true. In a perfect world, we'd run a randomized controlled trial for everything. But in the real world, we can't randomize who gets sick or who chooses a certain lifestyle. This lack of control opens the door for two major culprits that can derail our findings: bias and confounding.
Think of bias as a systematic error-a thumb on the scale that consistently pushes your results in one direction. It’s like a crooked rifle sight. No matter how carefully you aim, every shot will be off in the same way. In a study, this means you might overestimate a drug's benefit or invent a connection between two things that isn't really there.
Confounding, on the other hand, is more like a magic trick. It's a hidden variable that creates an illusion of a direct relationship between the two things you're studying. This third factor is tied to both your exposure and your outcome, creating a false connection that can easily mislead you. Getting a handle on both of these issues is fundamental to producing research that anyone can trust.
Unpacking the Usual Suspects: Common Biases
Bias can worm its way into a study at any point, from the way you choose your participants to how you analyze the numbers. The first step in fighting it is knowing what to look for. While there's a whole rogue's gallery of biases, a few are repeat offenders in observational studies.
Here are three you absolutely need to have on your radar:
- Selection Bias: This happens when your study group isn't a fair representation of the population you're interested in. For instance, if you recruit people for a heart disease study from a specialized cardiology clinic, your sample will likely be sicker than the general population. This will almost certainly skew your results.
- Information Bias: This is all about systematic mistakes in how you measure or record data. Imagine a study where the case group’s blood pressure is measured with a brand-new digital cuff, but the control group’s is measured with an old, less reliable manual one. The equipment difference itself introduces an error that has nothing to do with the biology you're trying to study.
- Recall Bias: A classic problem in case-control studies. It's human nature: people who have a disease tend to search their memories much harder for a potential cause than healthy people do. A patient might vividly recall past exposures they suspect made them sick, while a healthy control participant might barely give it a thought, leading to very different "data."
The Coffee, the Cigarettes, and the Confounder
To really get your head around confounding, let’s look at the famous case of coffee drinking and heart disease. Back in the 1970s, a handful of studies sounded the alarm: people who drank lots of coffee appeared to have a much higher risk of heart disease. It was a scary headline, but it missed the real story.
What was going on? Researchers eventually spotted the hidden variable: smoking. In that era, heavy coffee drinkers were very often heavy smokers. We already know smoking is a major, independent risk factor for heart disease. So, smoking was connected to the exposure (coffee) and the outcome (heart disease), creating a powerful illusion.
Once researchers went back and statistically controlled for smoking, the direct link between coffee and heart disease all but vanished. The association they saw wasn't wrong-it was real-but their interpretation was. It was a textbook case of confounding.
Outsmarting Bias with Smart Statistics
So, what can we do? You'll never eliminate every last shred of potential bias or confounding, but with a smart study design and the right statistical tools, you can put up a very strong defense. This is where meticulous planning and modern analytical techniques really shine.
Here are a few of the go-to methods researchers use to level the playing field:
- Matching: This is a bit like picking teams for a school sports day to make them fair. You pair each person in your treatment group with a person in the control group who is similar in key ways (like age, sex, or smoking habits). This creates balanced groups from the get-go, helping to neutralize the influence of those known confounders.
- Stratification: This is a classic "divide and conquer" strategy. You slice your data into different layers, or "strata," based on the confounder. For the coffee study, you could have analyzed smokers and non-smokers as two separate groups. If the coffee-heart disease link disappeared in the non-smoking group, that's a huge clue that smoking was the real driver.
- Multivariable Regression: This is a statistical powerhouse. It allows you to build a mathematical model that examines the link between your main exposure and outcome while simultaneously accounting for several other variables. It's a way of statistically "adjusting" for potential confounders to isolate the one true effect you actually care about.
Building Your Study with the OMOPHub SDK
Okay, so you've designed your study and have a solid plan to tackle bias. Now comes the hard part: turning that blueprint into a functioning research pipeline. This is where the theory hits the road, and it often involves the painstaking work of finding the right codes, mapping them, and defining your patient cohort. These tasks can be a real slog.
This is exactly where modern tools make a world of difference. Instead of wrestling with clunky, local vocabulary databases, researchers and data engineers can now access everything they need programmatically. With a platform like OMOPHub and its dedicated Software Development Kits (SDKs) for Python and R, these foundational steps can be automated and woven directly into your existing workflow.
Let's break down what this looks like in practice.
Streamlining Vocabulary Lookups
The first hurdle is always finding the right standard codes for the concepts you're studying. Say your research is on "Type 2 Diabetes." You'll need to hunt down every relevant SNOMED CT, ICD-10-CM, and other standard concept ID to build an accurate patient group. Doing this by hand isn't just tedious; it's a recipe for errors.
The OMOPHub SDK turns this into a simple, scriptable task. You can query the entire OHDSI ATHENA vocabulary set directly through an API call.
Here’s a quick look at how you'd use the OMOPHub Python SDK to find concepts related to "Type 2 diabetes mellitus."
import os
from omophub.client import Client

# Initialize the client with your API key
# Tip: Store your API key as an environment variable for security.
client = Client(api_key=os.environ.get("OMOPHUB_API_KEY"))

# Search for concepts
# Tip: Be specific in your query and filter by relevant vocabularies
# to get more accurate results.
response = client.concepts.search(query="Type 2 diabetes mellitus",
                                   vocabulary=["SNOMED", "ICD10CM"],
                                   limit=5)

# Print the results
for concept in response.concepts:
    print(f"ID: {concept.concept_id}, Name: {concept.concept_name}, Vocab: {concept.vocabulary_id}")
This little script does in seconds what could take hours of manual searching. You can dig into all the possibilities in the official OMOPHub Python SDK documentation.
Building Mappings Programmatically
Once you have your standard concepts, the next step is mapping your local, source-specific codes to them. This ETL (Extract, Transform, Load) process is a notorious bottleneck in observational research. The OMOPHub SDK simplifies this by letting you define and manage these mappings in code, making them reproducible and easy to version control. You can get a deeper dive into structuring your data in our guide on the OMOP Common Data Model.
Getting this initial data design and mapping right is critical. As the image below illustrates, the entire process for addressing bias depends on a solid foundation.
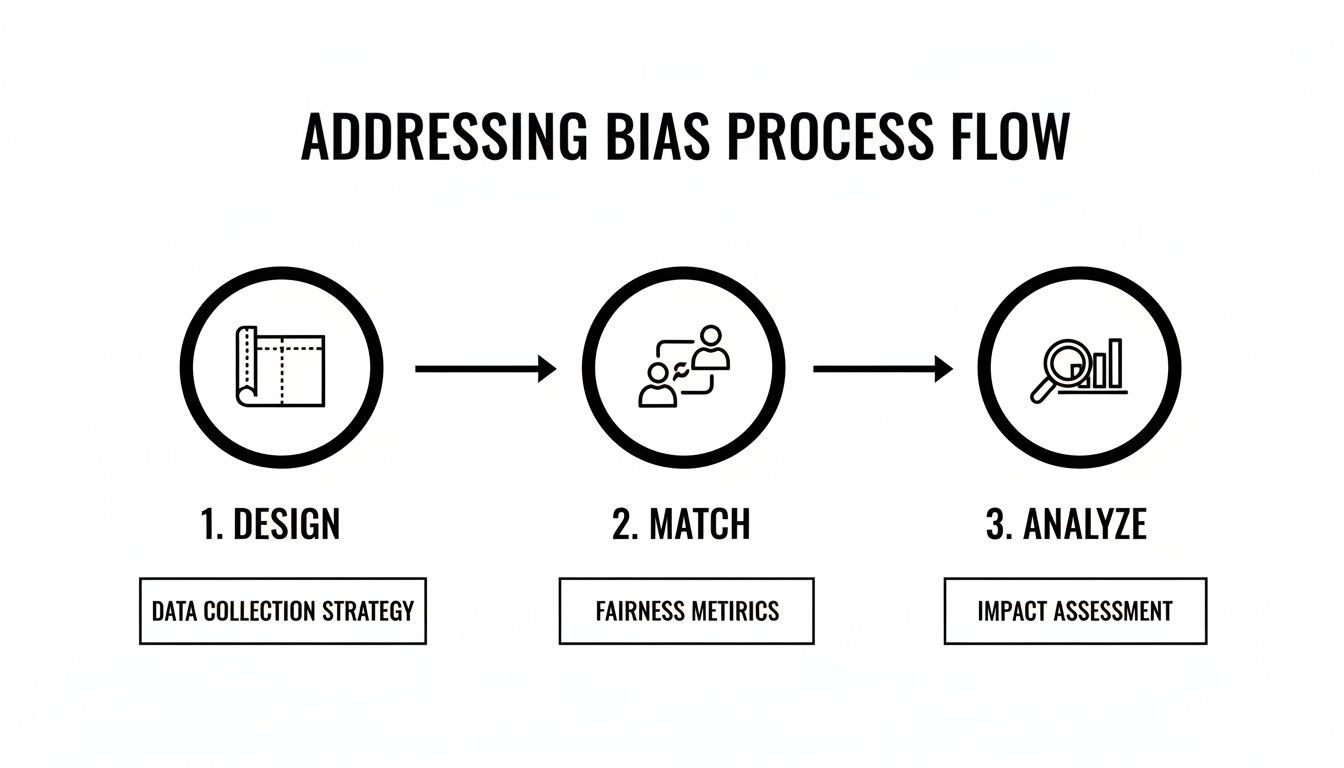
This flow-from meticulous design to careful matching and analysis-shows that the quality of your entire study hinges on getting the foundational data work right from the very start.
Defining Cohorts with Code
With your concepts identified and mappings locked in, you can now define the exact patient population for your study. A cohort definition is really just a list of inclusion and exclusion criteria based on standard concept sets. Scripting this process ensures your cohort is defined precisely the same way every single time-an absolute must for reproducibility.
The OMOPHub GitHub repositories for both Python and R are packed with examples and documentation to get you up and running. These open-source tools give research teams the power to build robust, automated, and transparent data pipelines for their observational studies.
Key Takeaway: When you shift essential tasks like vocabulary lookups, mapping, and cohort definition from manual drudgery to code-based workflows, you don't just speed things up. You improve accuracy and build your study on a rock-solid, reproducible foundation.
Ultimately, these tools are designed to take the infrastructure burden off your shoulders. This frees you up to focus less on data logistics and more on generating the insights that can actually improve patient outcomes.
7. Ensuring Reproducibility and Regulatory Compliance
The credibility of any observational study really comes down to two things: can someone else replicate your work, and did you follow the rules? If you can't say yes to both, even the most brilliant findings are built on shaky ground. When you're dealing with personal health information, navigating the maze of regulations isn't just a good idea-it's an absolute must, both legally and ethically.
That’s why features like end-to-end data encryption and immutable audit trails are table stakes. They're the technical foundation for security, creating a crystal-clear record of who touched the data and when. It’s all about accountability.
Adhering to Global Data Privacy Standards
Working with health data means you have to get intimately familiar with the regulations protecting patient privacy. For instance, you simply can't touch US patient data without a deep understanding of HIPAA compliance for healthcare providers.
The same goes for Europe. Any study using data from European citizens falls under the General Data Protection Regulation (GDPR). These legal frameworks aren’t suggestions; they demand serious technical and organizational safeguards. Getting this right is how you build trust with patients and your research partners.
The Cornerstone of Scientific Trust
Beyond the legal checkboxes, the real point of research is to add to a reliable, shared pool of knowledge. This is where reproducibility becomes so critical. If another team can't follow your exact methodology and get a similar result, what good is your finding?
This principle is what turns a one-off observation into an established scientific fact. And building a reproducible study from the ground up demands a serious commitment to transparency.
Reproducibility in observational research isn’t just about getting the same answer; it's about providing a clear, transparent "map" of your methods so that others can retrace your journey, verify your results, and build upon your work.
To make that happen, a few things are non-negotiable:
- Standardized Vocabularies: Using common languages like SNOMED CT ensures everyone is on the same page analytically. It's the first step toward getting comparable results.
- Version-Controlled Code: Every analysis script, whether it’s in Python or R, needs to live in a version control system like Git. This creates a perfect, time-stamped record of the logic that produced your findings.
- Transparent Data Pipelines: The entire workflow-from raw data intake to the final analysis-ready dataset-has to be documented and automated. You can find out more about the importance of structured data in our article on real-world evidence.
This dedication to standardization is especially important when you’re trying to conduct research across vastly different economic landscapes. Just look at healthcare spending. In 2019, the per capita expenditure was under 100 international dollars in the Central African Republic, while it was over 10,000 in the United States. The only way to generate consistent evidence from such different systems is through meticulous data harmonization.
By embedding these principles of compliance and reproducibility deep into its core, the OMOP ecosystem helps create a trustworthy, collaborative global research environment-one where findings can be validated, trusted, and ultimately, built upon.
Answering Your Questions About Observational Research
As we've walked through the world of observational research, a few questions tend to pop up time and again. Let’s tackle some of the most common ones to clear up any lingering confusion and address the practical roadblocks researchers often face.
Can Observational Research Actually Prove Causation?
In a word, no. Observational research is brilliant at finding strong associations-powerful signals that a particular exposure and an outcome are linked. But it can't definitively prove one causes the other, at least not with the certainty of a Randomized Controlled Trial (RCT).
Think of it like this: an observational study might show that people who drink coffee (A) have lower rates of a certain disease (B). What it can't tell you is if some unmeasured factor (C)-like people who drink coffee also happen to walk more-is the real reason. Only the experimental control of an RCT, where you randomly assign people to drink coffee or not, can truly isolate cause and effect.
What's the Single Biggest Hurdle in This Kind of Research?
Without a doubt, the biggest challenge is wrestling with bias and confounding. Since you aren't controlling the environment or assigning exposures, the door is wide open for hidden variables (confounders) and systematic errors (bias) to creep in and skew your findings.
A meticulous study design, an incredibly precise cohort definition, and sophisticated statistical techniques like matching or multivariable regression are your best defenses. If you don't actively fight back against these threats, you risk drawing conclusions that are completely off the mark.
How Exactly Does OMOPHub Fit into This Picture?
OMOPHub is designed to solve the frustrating, time-consuming technical problems that bog down the start of nearly every observational study. Instead of spending weeks building local databases just to handle standard medical vocabularies, researchers can access them instantly and programmatically.
Here are a few ways you can put it to work right away:
- Find Concepts in Seconds: Use the SDK to look up standard codes for your study variables almost instantly. The OMOPHub documentation is full of examples to get you started.
- Put Your Mappings on Autopilot: You can script your entire ETL process by calling API endpoints that map your source codes to standard OMOP concepts. This makes your data pipeline transparent, repeatable, and easy to version.
- Define Cohorts with Code: Build your patient populations programmatically. This ensures your inclusion and exclusion criteria are applied with perfect consistency every single time you run an analysis. You can grab starter code from the SDK repositories for Python and R.
By taking care of the foundational infrastructure, OMOPHub lets your team get back to focusing on the science, not the setup.
Ready to speed up your study’s journey from design to discovery? With OMOPHub, you can stop managing vocabulary databases and start building scalable, reproducible data pipelines. Get started today at https://omophub.com.


