A Practical Guide to Real World Evidence Generation
Real World Evidence (RWE) is the clinical evidence we get from analyzing Real World Data (RWD)-health information gathered outside the strict confines of a traditional clinical trial. RWE gives us critical insights into how treatments and diagnostics actually perform in everyday medical settings, reflecting a far broader and more diverse patient population than highly controlled studies ever could.
What Is Real World Evidence and Why It Matters Now
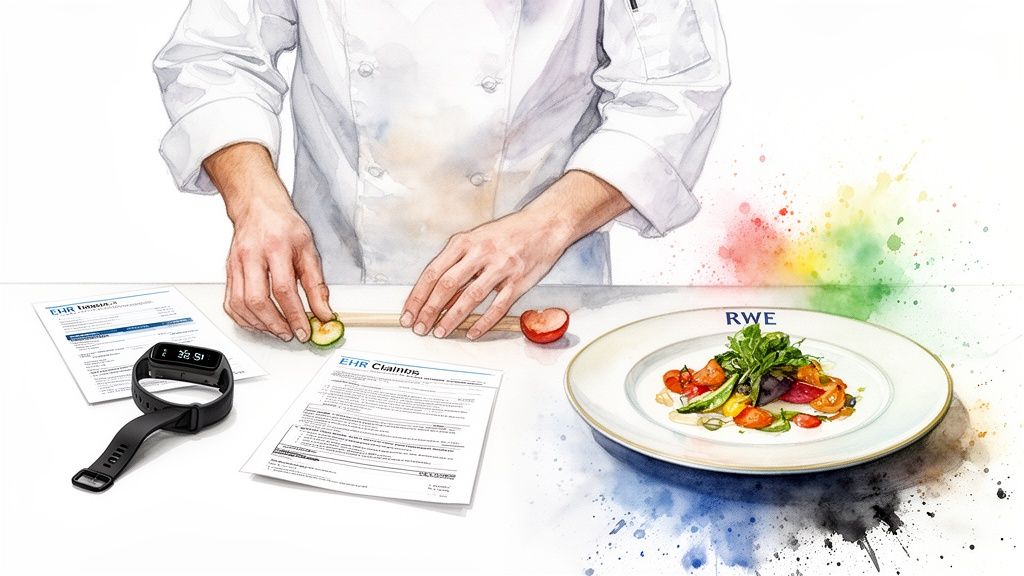
Think of it like cooking a meal. All the raw, unprocessed information from countless sources-electronic health records (EHRs), insurance claims, patient registries, and even wearable fitness trackers-is the Real World Data (RWD). These are your fresh vegetables, spices, and proteins waiting on the counter.
By itself, this raw data doesn't tell you much. It’s often messy, inconsistent, and was collected for entirely different reasons. This is where Real World Evidence (RWE) comes into play. RWE is the finished dish-the actionable insight created after a chef (a data scientist or clinical researcher) carefully cleans, prepares, and analyzes those raw ingredients using rigorous methods.
The distinction is crucial. RWD is the foundation, but RWE is the valuable output that actually guides medical decisions. To make it clearer, here’s a simple breakdown.
RWD vs RWE At a Glance
The table below offers a quick comparison, distinguishing between the raw data (RWD) and the analytical insights derived from it (RWE). It highlights their key differences in form and function.
| Attribute | Real World Data (RWD) | Real World Evidence (RWE) |
|---|---|---|
| Form | Raw, unstructured or semi-structured information | Curated, analyzed, and contextualized information |
| Source | EHRs, claims data, wearables, patient registries, etc. | Generated from the analysis of one or more RWD sources |
| Nature | The "what" (e.g., a lab value, a diagnosis code) | The "so what" (e.g., the drug's effect on lab values) |
| Example | A patient's recorded blood pressure reading | A study conclusion showing a drug's effectiveness at lowering blood pressure in a specific patient population |
Ultimately, RWD is the collection of individual data points, while RWE is the knowledge we gain after we've put those points together to answer a specific clinical question.
The Shift Beyond Clinical Trials
For decades, the Randomized Controlled Trial (RCT) has been the gold standard for generating clinical evidence. RCTs are incredibly powerful because they control variables in a sterile environment to isolate a treatment's specific effect.
But that control is also their biggest weakness. RCTs often exclude patients with multiple health conditions or those from diverse demographic backgrounds-the very people clinicians see every single day.
Real World Evidence helps fill this gap. It captures the complex, messy reality of healthcare, showing how a therapy works for a broad population over long periods.
By reflecting everyday clinical scenarios, RWE provides a more complete picture of a treatment's safety, effectiveness, and value across different patient groups who may not have been included in the original trials.
Who Benefits from Real World Evidence?
The impact of RWE is felt across the entire healthcare system. Understanding who it helps is the first step toward building smarter, data-driven strategies.
- Patients: Get access to treatments proven effective for people with similar health profiles, not just idealized trial participants.
- Providers: Can make more informed decisions based on evidence that reflects their actual patients.
- Regulators: Use RWE to monitor post-market safety and make decisions on expanding a drug’s approved uses. In fact, between 2019 and 2021, 85% of FDA drug approvals incorporated RWE in some fashion.
- Life Science Companies: Can accelerate research, better demonstrate a product's long-term value to payers, and pinpoint unmet medical needs far more efficiently.
This guide will walk you through the entire process of generating high-quality Real World Evidence. We'll cover everything from navigating data sources to standardizing them with tools that accelerate your entire workflow, turning raw data into meaningful insights faster and more reliably.
A Tour of Real-World Data Sources
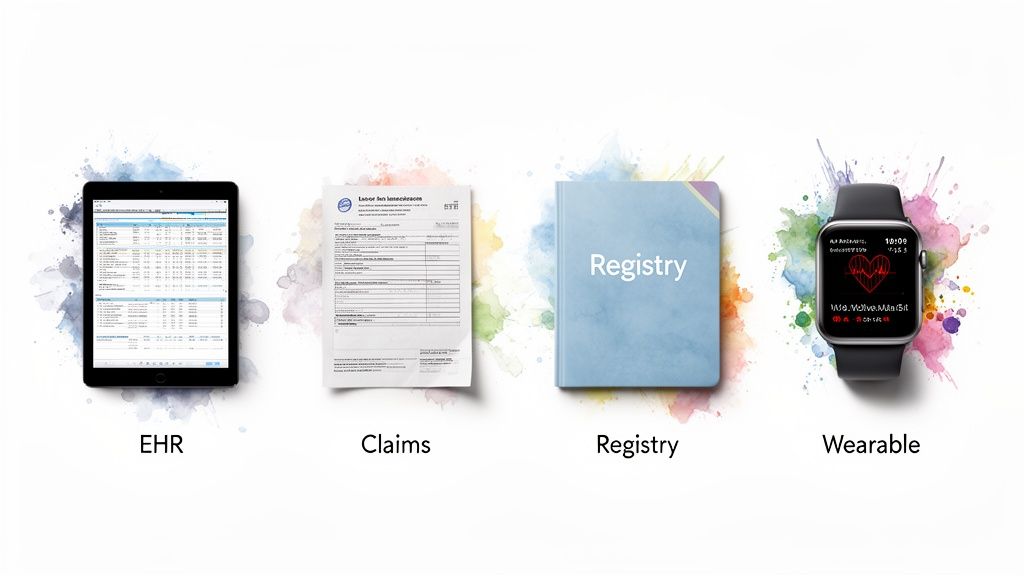
To build reliable real-world evidence, we first need to understand the raw materials we're working with. Real-World Data (RWD) is gathered from countless points across the healthcare system, and each source gives us a slightly different angle on the patient's story.
These sources are the foundation of any RWE study, but here's the catch: they were almost never created with research in mind. This means every dataset has its own quirks, strengths, and blind spots. Acknowledging these differences is the critical first step for any researcher or data engineer trying to design a study that is both insightful and structurally sound. The real work lies in weaving these messy, disconnected datasets into a single, coherent narrative.
Electronic Health Records (EHRs)
Think of EHRs as the digital version of a patient’s bedside chart. They are a treasure trove of clinical details, capturing everything from a doctor’s notes and lab results to diagnoses and prescriptions during each patient visit.
The incredible clinical depth is their biggest advantage. EHRs offer a granular, moment-in-moment view of a patient’s condition and treatment path. But this richness comes at a cost. The data is notoriously unstructured, with crucial facts often buried in free-text clinical notes, which makes pulling out clean, usable information a serious challenge. EHRs also give you a siloed view, only showing the care that happened within one specific hospital or clinic network.
Claims and Billing Data
Every time a doctor’s office or hospital bills an insurance company, it generates claims data. This administrative data gives us a bird's-eye, longitudinal view of a patient's journey through the healthcare system, connecting the dots between different doctors, specialists, and hospitals.
The beauty of claims data lies in its structure and scale. It neatly captures diagnoses, procedures, and prescriptions over long periods, which is perfect for tracking things like healthcare spending or how often patients visit a doctor. Its main weakness? A lack of clinical context. It tells you what happened but not why. You might see that a prescription was filled, for example, but you won't see the lab results that led the doctor to write it.
If you want to dive deeper, you can learn more about claims data analytics in our detailed guide here: https://omophub.com/blog/claims-data-analytics
The core challenge in generating RWE isn't a lack of data. It’s the immense difficulty of transforming fragmented, inconsistent information into a unified, analysis-ready format. This transformation is where the real work begins.
Patient and Disease Registries
Registries are specialized data collections focused on patients with a specific disease, condition, or exposure-think a rare cancer or a new medical device. Unlike EHRs or claims, they are often designed from the ground up with research as the primary goal.
- Strength: Because they are purpose-built for research, registries usually contain high-quality, curated, longitudinal data that is much cleaner and more focused.
- Limitation: This focus is also their weakness. The data is specific to one condition or population, so the findings may not apply more broadly. Registries are also typically much smaller than massive EHR or claims databases.
The New Wave of Data Sources
Beyond these traditional pillars, a new generation of RWD is gaining traction and becoming central to modern research.
This includes:
- Patient-Generated Health Data (PGHD): This is information coming directly from wearables, health apps, and home monitoring devices. It provides a continuous stream of insight into a patient's daily life, from activity levels to blood sugar readings.
- Socioeconomic Data: Publicly available information can add crucial context about the social determinants of health-like income or access to transportation-that we know have a huge impact on patient outcomes.
- Genomic Data: As the cost of sequencing drops, genomic data is increasingly being linked to clinical records, paving the way for truly personalized medicine.
As you explore this diverse data landscape, knowing how to extract data from websites can be surprisingly useful for gathering publicly available information. Each of these sources holds a different piece of the patient puzzle. The true power of real-world evidence is only unlocked when we find ways to link them all together.
The Expanding Global Footprint of RWE Studies
Real World Evidence isn't just a buzzword anymore; it's become a global standard. What started as a niche concept in a few research hubs has exploded worldwide as healthcare systems, regulators, and life science companies grasp its power. We're seeing a fundamental shift in how medical evidence is generated and valued, moving beyond the confines of traditional clinical trials to answer questions that matter in the real world.
Several forces are fueling this momentum. The digitization of healthcare is creating a firehose of data from Electronic Health Records (EHRs), and governments are launching ambitious initiatives to tap into their national health data assets. This has created a fertile ground for research, turning regions across North America, Europe, and Asia into major contributors to the global body of real world evidence.
The Geographic Landscape of RWE Research
If you look at where RWE studies are happening, you'll see a dynamic and quickly evolving map. While established markets still lead the charge, emerging regions are catching up fast, bringing massive patient populations and fresh investments in health tech to the table. This geographic spread is fantastic because it helps us understand how a treatment actually works across diverse genetics, healthcare systems, and living conditions.
A deep dive into published research paints a clear picture. A review looking at studies up to February 2023 identified a staggering 944 real-world studies coming from 48 different countries. China was out front, contributing 37.9% of them, with the United States close behind at 19.7%. It’s a powerful illustration of how both Eastern and Western hemispheres are driving this field forward. You can dig into the numbers yourself by exploring the full global RWE study analysis for a breakdown by country and disease area.
The Need for a Universal Data Language
This global research boom is a massive opportunity, but it also comes with a serious headache. Picture teams in Germany, Japan, and Brazil all trying to study the same rare disease. Each team has incredibly valuable local data, but it's all captured in different languages, with different clinical codes, and stored in completely different formats.
Without a shared framework, combining these datasets to achieve the statistical power needed for meaningful insights is nearly impossible. This fragmentation is the single biggest barrier to unlocking the full potential of global real-world evidence.
This is exactly why a common data model is no longer a "nice-to-have"-it's a necessity. Think of it as a universal translator for health data, a Rosetta Stone that restructures all those disparate datasets into a single, consistent format and vocabulary.
Tips for Enabling Global Collaboration
- Adopt a Common Data Model (CDM): Getting your data into a standardized structure like OMOP is the first, most crucial step. It’s what ensures that a "diagnosis of hypertension" means the exact same thing in Seoul as it does in Seattle.
- Use Standardized Vocabularies: A CDM is only as good as the vocabulary it uses. You need tools that can map all those local, proprietary codes to international standards like SNOMED CT and RxNorm. For a closer look at how this works, check out the OMOPHub documentation on concept mapping.
- Build Federated Networks: Instead of pulling sensitive patient data into one central location, a federated network lets you run the analysis where the data lives. Only the aggregated, anonymous results are shared, which is a game-changer for respecting privacy laws while still enabling powerful, multi-national studies.
By adopting these practices, we can start breaking down the data silos that hold research back. This collaborative approach doesn't just speed up discovery; it ensures the real world evidence we create is truly global, representative, and ultimately, more impactful for patients everywhere.
Understanding Regulatory Acceptance and Industry Impact
The ground is shifting under the world of medical evidence. For decades, the Randomized Controlled Trial (RCT) was the undisputed gold standard. But now, major regulatory bodies are formally weaving real world evidence (RWE) into how they make decisions. This isn't just a minor tweak; it's a fundamental change in how we evaluate medical products across their entire lifespan.
We're moving past an RCT-only mentality and embracing a more holistic view of evidence. Regulators have come to appreciate that while RCTs are perfect for proving something works in a controlled, almost laboratory-like setting, RWE tells the crucial story of how that same treatment performs in the messy, complicated reality of everyday patient care.
The Regulatory Embrace of Real World Evidence
Global authorities like the U.S. Food and Drug Administration (FDA) and the European Medicines Agency (EMA) are not just passively accepting RWE-they're actively building the frameworks to support its use. They’ve moved beyond talking about potential and are now publishing concrete guidance on what high-quality, submission-ready RWE looks like.
The FDA, in particular, has been a major force for change. After releasing its initial framework in 2018, the agency picked up the pace, issuing seven draft guidances between June 2021 and January 2023. These documents tackle the nitty-gritty of data standards, using EHR and claims data, and designing robust studies. This flurry of activity, detailed in a review of the latest RWE guidance landscape, sends an unmistakable signal: the door is wide open for credible, well-designed RWE.
This regulatory acceptance is a game-changer. It validates using RWE for more than just post-market safety checks. Now, it’s being used for core decisions like label expansions, new indications, and fulfilling post-approval study requirements.
How RWE Is Reshaping the Industry
The ripple effects of this regulatory green light are touching every part of the healthcare world. Generating high-quality real world evidence has gone from a "nice-to-have" academic project to a core business need with very real consequences.
- Pharmaceutical Research: Companies are now running RWE studies alongside their clinical trials, building a continuous stream of evidence that demonstrates a product's value to payers and doctors right from the start.
- Payer Reimbursement: Insurers are increasingly looking at RWE to make coverage decisions. They want proof that a new, expensive drug actually delivers better results for their specific patient populations before they agree to pay for it.
- Clinical Practice: RWE is a powerful engine for refining how medicine is practiced. It provides the data that underpins and updates essential tools like clinical practice guidelines, which guide doctors' decisions every single day.
Tips for Generating Regulatory-Grade RWE
To create evidence that can stand up to regulatory scrutiny, the guiding principles must be transparency, rigor, and reproducibility. It's not easy, but it's essential.
- Prioritize Data Quality and Provenance: You have to be able to tell the complete story of your data-from where it was born to how it was prepared for analysis. This transparency is the bedrock of building trust with regulators.
- Use Standardized Data Models: Getting your raw data into a common data model like OMOP isn't just a good idea; it's practically a requirement. It makes your study's logic transparent and ensures others can replicate your findings.
- Leverage Standardized Vocabularies: Mapping all your local source codes to standard terminologies is critical for creating consistent, comparable results. To see how this is done systematically, the OMOPHub documentation on concepts is an excellent resource.
By baking these principles into their RWE workflows, organizations can produce evidence that is not only scientifically solid but also fit-for-purpose in a regulatory setting. Ultimately, this helps get safe and effective treatments to the patients who need them, faster.
Standardizing Data with the OMOP Common Data Model
Generating trustworthy real world evidence is flat-out impossible until you solve the data heterogeneity problem. Think about it: insurance claims, Electronic Health Records (EHRs), and patient registries each tell a part of the patient story, but they all speak different languages. This is precisely where the Observational Medical Outcomes Partnership (OMOP) Common Data Model (CDM) comes in.
You can picture the OMOP CDM as a universal blueprint for health data. It takes the messy, inconsistent structures from countless different sources and forces them into a single, predictable format. This structural alignment ensures that a "diagnosis" or a "procedure" means the same thing and is stored in the same way, whether the data originated in a hospital in Ohio or a clinic in Tokyo. That’s what makes large-scale, reproducible research a reality.
Creating a Universal Language with Standardized Vocabularies
Of course, a common structure is only half the battle. To truly get these datasets to talk to each other, we also need a shared vocabulary. The OMOP CDM works hand-in-hand with a massive suite of standardized vocabularies, meticulously curated by the Observational Health Data Sciences and Informatics (OHDSI) community. This includes essential terminologies like SNOMED CT, LOINC, and RxNorm.
These vocabularies act as a Rosetta Stone for clinical concepts. They systematically map the thousands of local, proprietary codes for diagnoses, lab tests, and medications to a single, globally recognized standard. For example, all the different billing codes for "Type 2 diabetes" that a dozen hospital systems might use are all mapped back to one standard SNOMED CT concept.
This standardization is the secret sauce. It’s the critical step that transforms a pile of fragmented data points into a cohesive, analysis-ready dataset. It’s what gives researchers the confidence that when they compare cohorts across multiple databases, they are truly comparing apples to apples.
This whole process is fundamental to solving core industry challenges. All over the world, real world evidence is used to inform pharmaceutical companies on drug safety, guide nonprofits on patient outcomes, and help medical affairs teams communicate how a treatment really performs. To do that well, you need a rigorous, standardized approach that tackles data quality and ensures your results can be reproduced-a need constantly emphasized by organizations like ISPOR and ISPE. You can read more about the trends and practices shaping RWE generation to get a sense of the broader industry context.
The Challenge of Local Vocabulary Management
While incredibly powerful, trying to manage these standardized vocabularies on your own servers creates a huge operational headache. The vocabulary databases are massive, intricate, and constantly being updated.
Teams often run into the same hurdles:
- Complex Maintenance: Simply hosting and maintaining the enormous databases required for the vocabularies is a full-time infrastructure job.
- Versioning Nightmares: Keeping your local copies synced with the latest official releases from OHDSI is a manual, error-prone chore. It’s easy to fall behind.
- Performance Bottlenecks: Querying these gigantic tables for your ETL and mapping jobs can be painfully slow and inefficient without serious database optimization.
This becomes a major distraction for data engineers. Instead of focusing on building valuable analytical pipelines, they get stuck spending their time on low-level infrastructure and database administration. The real mission-generating real world evidence-gets bogged down in backend maintenance.
Abstracting Away the Complexity
The modern solution is to use vocabulary services that abstract this entire infrastructure burden away. By providing access to the vocabularies through a simple API, these services give data engineers all the mapping and concept relationship functions they need without ever having to host a database.
This approach lets teams get back to what they do best. Instead of wrestling with infrastructure, they can focus their brainpower on the logic of their ETL pipelines and the sophistication of their analytical models. To get a better handle on the structure itself, check out our guide explaining the core principles of a common data model.
Tips for Streamlining Vocabulary Integration
- Use a Vocabulary API Service: This is the easiest win. It eliminates the need to host vocabularies locally and gives you instant access to the latest versions without any database work. You can find examples in the OMOPHub documentation for searching concepts.
- Automate Mapping in ETL: Build vocabulary lookups directly into your data transformation pipelines. As new data flows in, you can programmatically map the source codes to standard OMOP concepts on the fly. The OMOPHub SDKs for Python and R offer tools built for exactly this purpose.
- Validate Mappings Rigorously: Don’t just map and move on. Use the vocabulary’s built-in relationship tables to double-check your mapping logic and ensure it’s clinically accurate before you finalize the dataset.
Making RWE Pipelines Actually Work with Modern Tools
Getting from raw, messy data to high-quality real world evidence takes a pipeline that’s solid, repeatable, and efficient. While the OMOP Common Data Model gives us the blueprint, the real grunt work happens during the Extract, Transform, and Load (ETL) phase. This is where most projects get bogged down. Modern tools are built specifically to break through these bottlenecks, automating the complex parts so data engineers can focus on finding insights, not just wrestling with infrastructure.
The biggest headache in any RWE pipeline is semantic mapping-the act of translating all the different source-specific codes into standardized OMOP concepts. When you try to do this by hand, it’s brutally slow and mistakes are almost guaranteed. This is where specialized SDKs and APIs come in. They let teams run these mappings programmatically, building speed and consistency right into the workflow from the start.
This diagram shows the basic journey from a chaotic mess of raw data to a clean, standardized dataset ready for analysis.
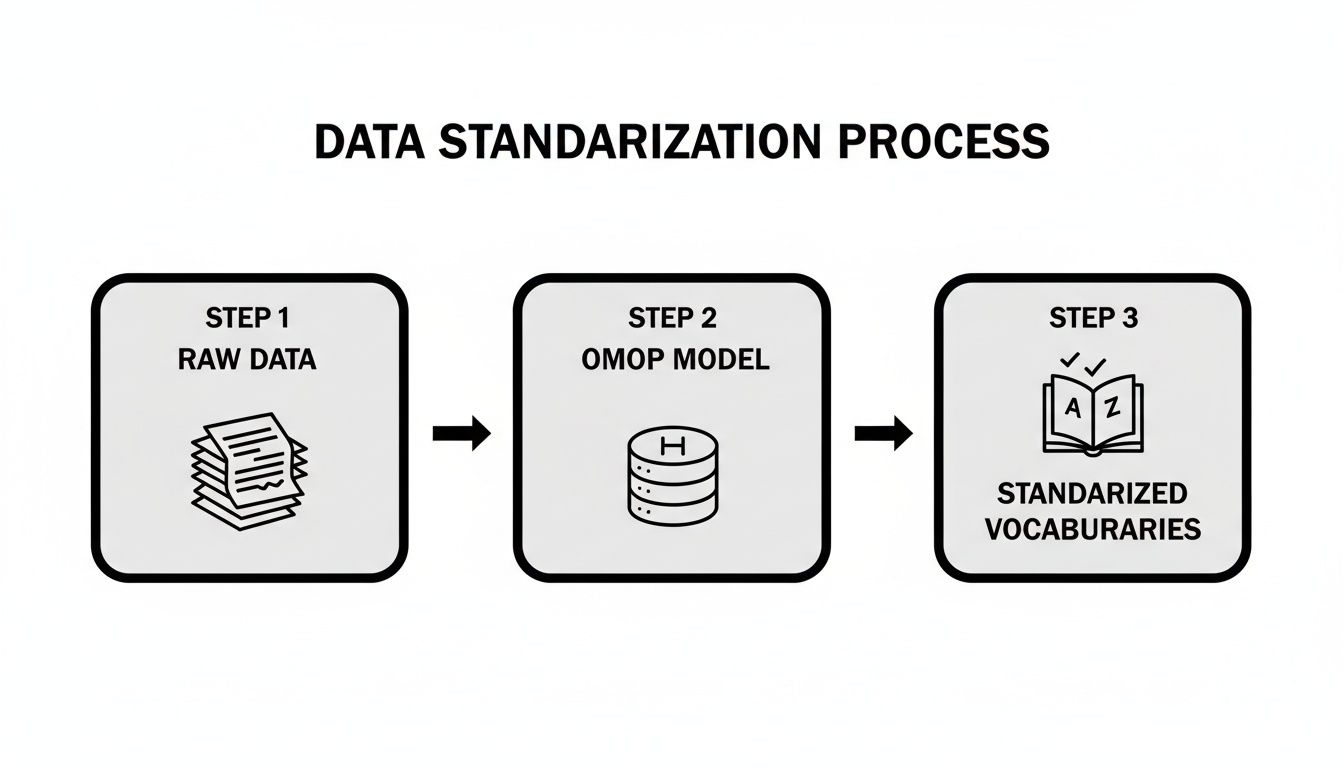
You can see how different raw data sources are first squeezed into the OMOP structure, then harmonized with standard vocabularies to make sure the insights you pull are reliable.
Automating Vocabulary Mapping with SDKs
Let's get practical. Say you need to find every patient with 'Type 2 Diabetes'. Your source data might have dozens of codes for this one condition, scattered across ICD-9-CM, ICD-10-CM, and maybe even some homegrown system. Something like the OMOPHub Python SDK lets you find the standard concept and all its related source codes with just a few lines of code.
Here's a quick look at what that looks like. You can write a simple script that automates what would otherwise be a soul-crushing manual search through massive vocabulary tables.
from omophub import Client

# Initialize the client with your API key
client = Client(api_key="YOUR_API_KEY")

# Search for the concept 'Type 2 diabetes mellitus'
concepts = client.concepts.search(query="Type 2 diabetes mellitus")

# Print the standard concept ID
for concept in concepts:
    if concept.standard_concept == "S":
        print(f"Standard Concept ID for Type 2 Diabetes: {concept.concept_id}")
        break
This tiny script returns the exact standard concept ID you need for your analysis. For teams working in different environments, similar toolkits exist, including an SDK for R users who prefer it for statistical work.
Building Cohorts by Following the Breadcrumbs
Finding one concept is a good start, but it’s rarely enough. Real-world cohort definitions are more nuanced. A study on diabetes isn't just about the main diagnosis; you probably need to include related complications or synonymous terms. Modern vocabulary services let you trace these complex relationships automatically.
The ability to programmatically explore concept hierarchies-finding parent, child, and mapped-from relationships-is what turns a static data model into a dynamic discovery tool. This is how you build clinically accurate cohorts without spending months on it.
This technique dramatically speeds up the creation of a comprehensive cohort definition file, which you can then use to query your OMOP database and find the right patients.
Practical Tips for Building Better RWE Pipelines
To build workflows that are scalable, secure, and reproducible, here are a few best practices straight from the field.
- Automate Vocabulary Lookups in Your ETL: Don't do manual mapping. Instead, embed API calls to a vocabulary service like the one described in the OMOPHub API documentation directly into your ETL scripts. This keeps mappings consistent and ensures you're always using the latest vocabulary versions.
- Version Control Everything: Treat your cohort definitions and ETL scripts like software code. Use Git or a similar system to track every change. This makes your entire analytical process transparent and, most importantly, reproducible.
- Insist on Performance and Security: Choose tools that are fast and have compliance built-in. Quick API response times are essential for interactive analysis and crunching large datasets. At the same time, things like end-to-end encryption and audit trails are non-negotiable for meeting enterprise security and regulatory demands.
By bringing these tools and practices into your workflow, you can slash the time it takes to get from raw data to a meaningful answer. This makes generating timely and trustworthy real world evidence a far more achievable goal. To see how these ideas play out in a related field, check out our guide on Health Economics and Outcomes Research (HEOR).
Common Questions on Generating Real-World Evidence
As more organizations bring real-world evidence into their decision-making, a lot of practical questions pop up. Let's tackle some of the most common ones to help you navigate your data standardization and analysis projects.
What’s the Single Biggest Hurdle in RWE Generation?
Hands down, the biggest obstacle is data fragmentation and heterogeneity. Real-World Data (RWD) comes from dozens of different places-EHRs, claims databases, patient registries-and none of these systems were ever built to talk to each other. They all have their own formats, coding systems, and data structures, which makes piecing them together a massive headache.
The real challenge in generating RWE isn't finding enough data; it’s the monumental task of wrangling all that fragmented, messy information into a single, cohesive format that you can actually analyze. That transformation process is where the real work happens.
How Does OMOP Help with Data Quality?
It’s a common misconception that the OMOP Common Data Model (CDM) magically fixes all data quality problems. What it really does is solve for structural and semantic inconsistencies. It gives you a standard format and a common vocabulary, so you can confidently compare data that originated from completely different systems.
That said, the process of mapping your raw data to the OMOP CDM has a powerful side effect: it shines a bright light on the underlying quality issues. When you’re forced to map a messy source field to a clean, standardized concept, you inevitably uncover problems like missing values or incorrect codes. This forces your team to address those issues, resulting in a much cleaner dataset for analysis.
Can We Actually Use RWE for Regulatory Submissions?
Yes, absolutely. Regulatory agencies like the FDA and EMA are not just accepting RWE anymore; they're actively encouraging its use in certain situations. Some of the most common use cases include:
- Post-market safety monitoring: Keeping an eye on adverse events after a drug has already hit the market.
- Label expansions: Gathering evidence to show a drug is effective for a new patient group or a different condition.
- Fulfilling post-approval study requirements: Using RWD to run studies that were required as a condition of a drug's initial approval.
Tips for Creating Regulatory-Grade RWE:
- Document Everything: You need a crystal-clear audit trail for your entire data pipeline, from the moment you extract the source data to your final analytical output.
- Use Standardized Tools: Work with platforms that support repeatable, documented workflows. The OMOPHub Python SDK and R SDK are great for standardizing your vocabulary mapping.
- Validate Your Logic: Make sure your study design and analytical methods are transparent and scientifically robust. The OMOPHub documentation offers some great best practices for concept mapping.
Ready to speed up your RWE pipelines? Check out OMOPHub. Our developer-first platform gives you instant API access to standardized OHDSI vocabularies, removing the infrastructure burden so your team can build faster and with more confidence. Visit us at https://omophub.com to get started.


