A Practical Guide to Claims Data Analytics in Healthcare
Think of healthcare claims data not as a stack of bills, but as a detailed chronicle of the patient journey. Every single claim-for a doctor's visit, a lab test, a prescription-is a data point. When you learn how to connect these dots, you’re not just processing transactions; you're creating a strategic map of the entire healthcare landscape.
Understanding the World of Claims Data Analytics
At its heart, claims data analytics is the art and science of finding meaningful patterns in the torrent of healthcare billing information. A single claim is just a record of a service rendered. But when you bring millions of them together, they tell a powerful story about population health, treatment effectiveness, and operational performance.
This isn't just about financial reconciliation. It's about a deeper level of inquiry. An insurance provider might sift through claims to see which patient groups are driving the highest costs. A hospital system, looking at the very same data, might be trying to measure how well a new cardiac treatment protocol is working compared to the old one.

Why It Matters
The insights pulled from claims data ripple across the entire healthcare ecosystem, influencing clinical, financial, and operational decisions. Here’s where it makes a real difference:
- Improving Patient Outcomes: By tracking treatment pathways and results across huge populations, we can pinpoint what actually works, refining clinical best practices with real-world evidence.
- Managing Costs and Reducing Waste: Analytics quickly flags inefficiencies-like unnecessary procedures or gaps in preventive care-that lead to ballooning costs.
- Enhancing Operational Efficiency: From submission to payment, analyzing the claims process itself helps cut down administrative burdens and speed up revenue cycles.
- Detecting Fraud and Abuse: Advanced algorithms can spot suspicious billing patterns that a human might miss, protecting the system from major financial losses.
Healthcare organizations that master claims data analytics gain a serious edge. They stop being reactive-just paying bills as they come in-and become proactive, using data to strategically shape care delivery and financial planning.
Getting Started: A Practical Tip
Before you even think about building complex models, just get to know your data. A fantastic first step is simple data profiling. Run a basic SQL query to count the most common diagnosis codes (like ICD-10) in your dataset. This simple act tells you a ton about the patient population and can immediately highlight potential data quality problems.
This guide will take you through the entire process. We'll start by breaking down the anatomy of a claim, then cover the critical steps of data normalization, and finally, explore the analytical methods that unlock the true value hidden in this data.
2. The Anatomy of a Healthcare Claim
To get anywhere with claims data analytics, you have to learn the language of the claim itself. It's a mistake to think of a claim as just a bill. A better way to see it is as a dense, coded story of a single patient encounter. An analyst's job is to decode the fields and codes within that story to understand a specific moment in a patient's healthcare journey. Getting this part right is absolutely foundational-skip it, and you're guaranteed to build shaky data pipelines and make some expensive analytical mistakes down the road.
At their core, claims are just standardized forms created for one reason: getting paid. You'll primarily run into two types: medical claims and pharmacy claims. While they look different, they're both trying to answer the same fundamental questions: who received care, who provided it, when did it happen, what was done, and why?
Unpacking the Medical Claim
For most professional medical services in the U.S., the go-to format is the CMS-1500 form, or its electronic cousin, the 837P transaction. This is what doctors, specialists, and other individual providers use to bill insurance. Think of it as a super-detailed invoice for a doctor's visit, capturing every crucial piece of the puzzle.
Here's a quick look at the essential data elements you'll find on a standard medical claim and the coding systems they use.
| Key Data Elements in a Standard Medical Claim | ||
|---|---|---|
| Data Element | Description | Common Vocabulary/Format |
| Patient Information | Basic demographics like name, date of birth, gender, and insurance ID. | Alphanumeric |
| Provider Information | Details on the rendering provider and billing facility, identified by their unique NPI. | NPI (National Provider Identifier) |
| Dates of Service | The specific start and end dates when the care was actually delivered. | YYYY-MM-DD |
| Diagnosis Codes | The "why" of the visit. These codes justify the medical necessity of the services. | ICD-10-CM (International Classification of Diseases) |
| Procedure Codes | The "what" of the visit. These codes describe the specific services or procedures performed. | CPT (Current Procedural Terminology) / HCPCS |
Mastering the interplay between these fields is what separates a good analyst from a great one. You have to be able to connect the dots.
The real story is in the relationship between the diagnosis and procedure codes. This linkage is everything. It answers the fundamental question: "Because the patient presented with this diagnosis, the provider performed this procedure."
Decoding the Pharmacy Claim
Pharmacy claims operate on a completely different standard, usually the NCPDP Telecommunication Standard. The structure is different from a medical claim, but the goal is identical: to process payment for a medication that a pharmacy has dispensed.
Here, the key pieces of information are:
- Patient and Prescriber Details: Just like a medical claim, you need to know who the patient is and which doctor wrote the prescription.
- Drug Information: This is the most critical part, identifying the exact drug using its NDC (National Drug Code).
- Dispensing Details: This includes practical info like the quantity of the drug provided, the number of days' supply it's meant to last, and the fill date.
This distinction isn't just academic-it's critical. You can't apply the same analytical logic to a medical claim and a pharmacy claim. They use entirely different coding systems (NDC vs. CPT/ICD) and describe completely different kinds of healthcare events. By truly understanding the anatomy of both, you start building the vocabulary needed to turn a flood of raw billing data into a clear, longitudinal picture of patient care.
The Journey from Raw Data to Actionable Insight
Raw claims data is a mess. Let's be honest. In its native state, it’s like a massive, disorganized library where every book is written in a different dialect. It's brimming with potential, but without a common language, it's just noise. The real work in claims data analytics is turning that chaos into clarity, and that journey is a structured process of translation and organization.
It all starts with a foundational data engineering process: Extract, Transform, Load (ETL). This is the heavy lifting required to take messy, inconsistent source files and start imposing some order.
- Extract: First, you pull the data from wherever it lives-billing systems, payer portals, clearinghouses, you name it.
- Transform: This is where the magic happens. Data gets cleaned, duplicates are purged, and formats are standardized. One file might have a date as "01-05-2025" while another uses "Jan 5, 2025." The transform step forces them to conform to a single, consistent standard.
- Load: Finally, the cleaned and structured data is loaded into its new home, typically a data warehouse, where it's ready for analysis.
Creating a Common Language with OMOP CDM
Getting your data clean is a great first step, but it doesn't solve the "different dialects" problem. Every provider, payer, and health system seems to have its own local codes and conventions. To run any kind of reliable, large-scale analysis, you need a universal translator. This is precisely the role of the OMOP Common Data Model (CDM).
Maintained by the OHDSI community, the OMOP CDM is an open standard designed to give healthcare data a consistent structure and vocabulary. Think of it as a universal blueprint for a patient's entire medical journey. It allows you to stitch together data from countless different sources into a single, coherent, research-ready record.
When you map claims data to OMOP, you're not just organizing it; you're giving it context.
- An ICD-10 diagnosis code from a claim finds its home in the CONDITION_OCCURRENCE table.
- A CPT procedure code is neatly filed into the PROCEDURE_OCCURRENCE table.
- An NDC code for a filled prescription goes into the DRUG_EXPOSURE table.
This meticulous mapping is the heart of data normalization. It’s what enables an analyst to ask a simple question-"How many patients with Type 2 Diabetes were prescribed Metformin?"-and get a meaningful answer that pulls from thousands of different sources, all speaking the same analytical language.
The flow is pretty straightforward when you think about it: a patient event happens, and it generates specific data points for a claim.
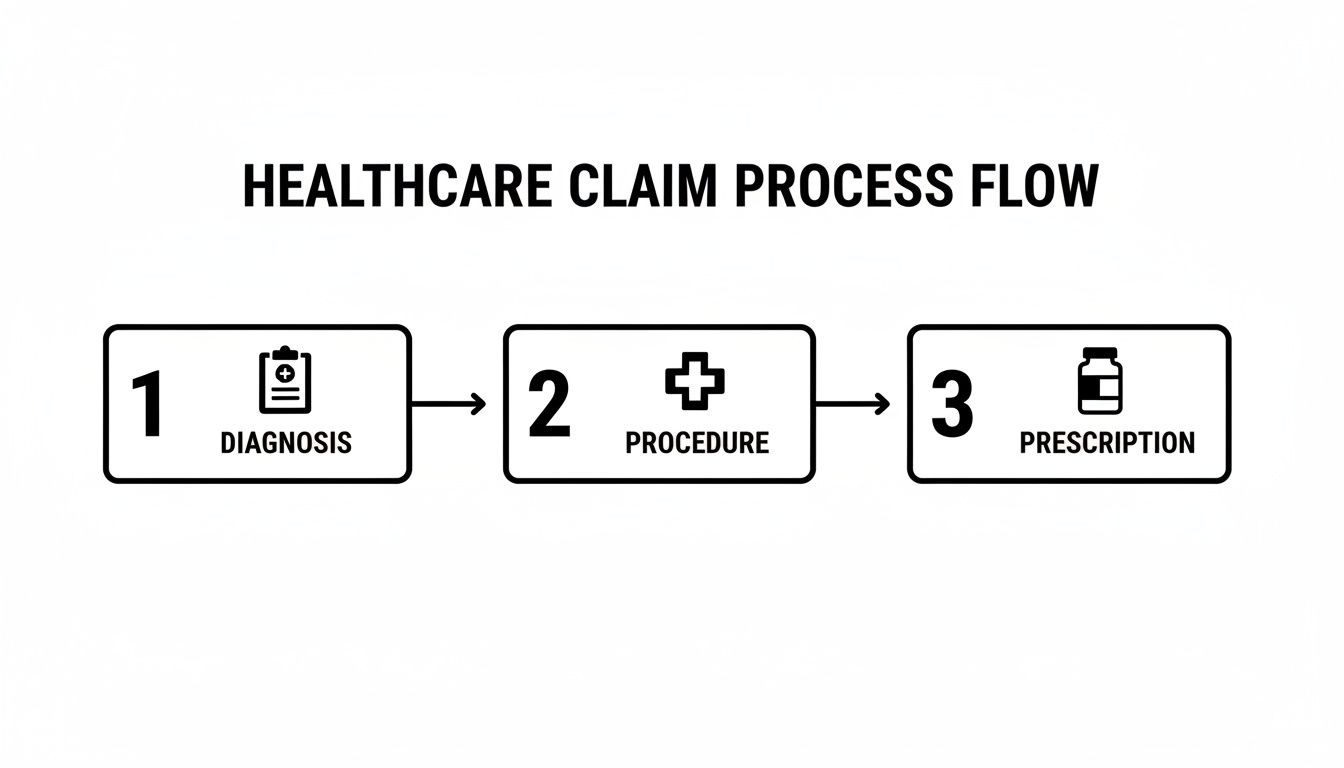
Each of these steps-diagnosis, procedure, prescription-creates a code that becomes a building block for that patient's longitudinal record within the OMOP CDM.
Speeding Up Vocabulary Mapping with an SDK
Let's be real: the toughest, most tedious part of this whole process is vocabulary mapping. Trying to connect source codes like ICD-10-CM to the standard concepts in OMOP (usually SNOMED CT) by hand is painfully slow and a recipe for errors. This is where modern tooling makes a world of difference.
For example, a data engineer using the OMOPHub Python SDK can find the right standard concept for any given source code programmatically, with just a few lines of code. This completely automates what used to be a major bottleneck in the ETL pipeline.
Here’s a quick look at how simple it is to map an ICD-10-CM code for "Type 2 diabetes mellitus without complications" to its standard SNOMED CT equivalent using the OMOPHub Python SDK.
import os
from omophub.client import Client

# Initialize the client with your API key
client = Client(api_key=os.environ.get("OMOPHUB_API_KEY"))

# Find the standard concept mapping for a source code
mappings = client.source_to_standard(
    source_code="E11.9",
    source_vocabulary_id="ICD10CM"
)

# Print the first standard concept found
if mappings:
    standard_concept = mappings[0].standard_concept
    print(f"Source Code: E11.9 ({standard_concept.vocabulary_id})")
    print(f"Maps to Standard Concept ID: {standard_concept.concept_id}")
    print(f"Standard Concept Name: {standard_concept.concept_name}")
This kind of automation removes the need to maintain massive, clunky local vocabulary databases and spend hours on manual lookups. You can see more examples and dive into the technical details on the official OMOPHub docs site.
This push for automation and standardization is exactly why there's so much investment pouring into this space. The global healthcare analytics market is on track to hit $75.1 billion by 2025-a nearly sixfold jump from 2019. That growth is fueled by the undeniable power of analytics to cut claim denials, improve billing accuracy, and speed up payment cycles. Tools that provide instant API access to vocabularies are critical because they power the AI and machine learning workflows that turn raw claims into a real strategic asset. You can find more insights on the healthcare analytics market's growth and what's driving it.
By getting data out of its raw state and into a standardized, analyzable format, organizations finally unlock the ability to see the bigger picture-gaining insights that were simply out of reach before.
Unlocking Value with Core Analytical Methods
So, you’ve done the heavy lifting. Your claims data is clean, structured, and sitting nicely in a model like the OMOP CDM. All that foundational work is complete. Now, the fun really begins.
The focus shifts from preparation to application. You can finally start asking the big questions that lead to real-world improvements-financially, operationally, and clinically. This is where claims data analytics truly shines, turning standardized data into actionable intelligence.
Most organizations follow a natural progression through three stages of analytics, with each one building on the last to paint an increasingly detailed picture. It's a journey from looking in the rearview mirror to seeing clearly what’s on the road ahead.
Descriptive Analytics: What Just Happened?
The first and most fundamental step is descriptive analytics. Its job is to summarize historical data and give you a clear, high-resolution map of your claims landscape. It’s all about understanding past performance.
This method helps answer questions like:
- Which patient groups are driving the highest costs?
- What are the most common procedures we bill for a specific diagnosis?
- Which of our providers have the longest reimbursement cycles?
By spotting these patterns, you can start to pinpoint inefficiencies and opportunities. For instance, a hospital might dig into its descriptive analytics and discover that one particular surgical procedure has an unusually high readmission rate, which immediately prompts a clinical review.
Predictive Analytics: What’s Coming Next and Why?
Once you have a solid grasp of past events, you can start to anticipate the future with predictive analytics. This is where you use statistical models and machine learning to identify the likelihood of future outcomes based on all that historical data you just organized.
The power here is in preemption. Instead of just reacting to problems, you can see them coming. Predictive analytics tackles forward-looking questions:
- Which claims are most likely to be denied by a specific payer?
- Which patients are at the highest risk for hospital readmission within 30 days?
- What does our claims volume look like for the next quarter?
Imagine a predictive model flagging a claim for a potential denial before it even gets submitted. This gives the billing team a crucial window to correct coding or eligibility errors. It’s a game-changer for revenue cycle management.
Prescriptive Analytics: What Should We Do About It?
The final stage, prescriptive analytics, takes things a step further. It doesn't just predict what will happen; it recommends specific actions to take to get the best possible outcome.
This is the most advanced form of claims analytics because it directly guides decision-making. It might suggest the optimal clinical intervention to reduce a patient's length of stay or propose specific workflow changes to get payments in the door faster. Researchers working in health economics and outcomes research (HEOR) rely on these methods to model the real-world impact of different treatment pathways.
Measuring Success with Key Performance Indicators
To prove that all this analytical work is actually paying off, you have to track the right metrics. Key Performance Indicators (KPIs) are what connect your analytics efforts to tangible business results.
KPIs for Claims Data Analytics
- Denial Rate: The percentage of claims kicked back by payers. A lower rate is a clear sign of better initial claim quality.
- First Pass Resolution Rate (FPRR): The percentage of claims paid correctly on the very first submission. This is a primary measure of billing efficiency.
- Days in Accounts Receivable (A/R): The average number of days it takes to get paid. Bringing this number down directly improves cash flow.
Rising claim denials are a serious threat to a provider's bottom line. In fact, healthcare claim denial rates are climbing alarmingly in 2025, with a staggering 10% of all denials tracing back to inaccurate patient data collected at intake. This is where analytics platforms become critical. By dissecting historical data, they can flag eligibility issues and coding discrepancies before submission, with the potential to slash denial rates by 15-30%.
As organizations get more serious about data-driven strategies, they can turn chaotic billing cycles into a resilient and predictable claims ecosystem. You can explore more statistics on the state of claim denials to see just how high the financial stakes really are.
Navigating Compliance and Avoiding Common Pitfalls
Working with claims data isn't just an analytical challenge; it's a profound responsibility. Every record contains intensely personal information, and it's all protected by some seriously strict regulations. To really succeed with claims data analytics, you have to master two things at once: the technical side of the analysis and the unwavering ethical and legal diligence that goes with it.
This means thinking about privacy and security from day one, not as an afterthought. They are the absolute foundation of any trustworthy analytics program. Regulations like the Health Insurance Portability and Accountability Act (HIPAA) in the U.S. and the GDPR in Europe set the ground rules. Adhering to them isn't optional-it's the price of entry. For a deeper dive, you can review our detailed guide on achieving GDPR compliance.
Protecting Patient Privacy
A cornerstone of any compliant analytics project is the de-identification or anonymization of data. The idea is to remove direct patient identifiers-names, addresses, social security numbers-without gutting the data's analytical value.
But true anonymization is trickier than it sounds. Just deleting a name isn't enough. A unique combination of a rare diagnosis, a specific procedure date, and a zip code could easily point back to a single individual. You need robust strategies to prevent this kind of re-identification.
The HIPAA "safe harbor" method offers a straightforward checklist of 18 identifiers that must be stripped from the data. While it's a great starting point, most teams find they also need more advanced statistical methods to ensure individuals can't be re-identified through inference.
Sidestepping Common Project Derailers
Beyond the legal hurdles, a handful of technical and strategic pitfalls can completely sink a claims data project. Knowing what they are from the beginning helps teams build more resilient and reliable pipelines.
Here are three of the most common-and damaging-traps to watch out for:
- Poor Data Quality: The old "garbage in, garbage out" saying is brutally true here. Inaccurate coding, missing fields, or inconsistent formats will poison any analysis before it even starts. A rigorous data validation and cleaning process during the ETL phase is absolutely non-negotiable.
- Incorrect Vocabulary Mapping: A misplaced decimal on a financial report is bad, but mapping a diagnosis code to the wrong clinical concept is a catastrophe. It leads to dangerously flawed clinical insights and completely invalid conclusions. Using reliable, automated tools for vocabulary mapping is critical for accuracy, especially when you're standardizing everything to a model like OMOP.
- Ignoring Inherent Data Bias: Always remember: claims data is created for billing, not research. This fact alone introduces powerful biases. For instance, a condition might only get coded if it justifies a reimbursable procedure, which means you're not seeing the full picture. Analysts have to constantly question the data's original purpose and think critically about how that might be skewing their findings.
Architecting a Modern Claims Analytics Stack

Building a truly effective platform for claims data analytics isn’t just about picking the right tools; it’s about designing a modern, decoupled architecture. The old monolithic systems just can't keep up. The real goal is to build something scalable and flexible, freeing up your engineers to hunt for insights instead of wrestling with infrastructure. This means shifting to a nimbler, API-driven blueprint.
The foundation of any modern stack is how you handle the data itself. Forget rigid, old-school data warehouses. The most forward-thinking teams are embracing the data lakehouse model. This hybrid approach gives you the cheap, flexible storage of a data lake combined with the smart data management features of a warehouse. It becomes your single source of truth for everything from raw claim files to fully processed, analysis-ready data.
Core Architectural Components
The magic happens when you assemble components that play well together. A high-performance stack that we see working in the real world typically includes a few key pieces:
- Data Ingestion: You need a reliable way to get data from point A to point B. Tools like Fivetran or Airbyte are great for pulling claims data from all your different sources into the lakehouse.
- Storage and Processing: This is the engine room. Platforms like Databricks or Snowflake act as the lakehouse, with Apache Spark doing the heavy lifting for large-scale data transformation.
- Vocabulary Management: This is the secret weapon. Instead of managing vocabularies yourself, you use a dedicated, API-first service like OMOPHub to handle all your medical terminology needs.
That last part is a game-changer. Trying to manage vocabulary databases internally is a massive operational headache. They're enormous, incredibly complex, and demand constant updates.
Decoupling vocabulary management through an API is a massive strategic win. It pulls the burden of maintaining terabytes of terminology data out of your core pipeline. Your team gets instant, programmatic access to the latest codes without ever having to manage the underlying database.
Integrating a Vocabulary API
Once you plug in a service like OMOPHub, one of the gnarliest parts of your ETL process becomes surprisingly simple. Forget writing convoluted SQL joins to map codes. Now, your engineer just makes a quick API call.
For instance, when a new claims file lands in your system, a Spark job can ping the OMOPHub API to validate ICD-10 codes or map them to standard SNOMED concepts on the fly. This developer-first approach cuts down pipeline development time dramatically.
Here’s a quick look at how you might search for a concept using the OMOPHub R SDK. It's clean and straightforward. You can find more in-depth examples for Python and R over at the OMOPHub documentation.
# Load the OMOPHub R library
library(omophub)

# Set your API key
Sys.setenv(OMOPHUB_API_KEY = "YOUR_API_KEY")

# Search for concepts containing "diabetes" in ICD10CM
concepts <- search_concepts(query = "diabetes", vocabulary_id = c("ICD10CM"))

# Print the resulting concepts
print(concepts)
This kind of efficiency is becoming non-negotiable. With claim volumes surging, the U.S. Medical Claims Processing Services industry is expected to hit $5.7 billion in 2025. You can discover more insights about claims processing industry growth and see why a scalable architecture is so critical. Platforms that provide instant, API-based access to vocabularies are the only way to handle that kind of volume without buckling.
By embracing this modern, API-first architecture and using tools like the OMOPHub Python SDK, engineering teams can build faster and more reliable claims analytics pipelines. And as you can see in the latest SDK release notes, these tools are constantly improving to make the process even smoother.
Common Questions We Hear
When teams first start working with claims data, a few key questions almost always come up. Getting these sorted out early on helps everyone understand the road ahead-both the challenges and the real opportunities. Let's tackle some of the most common ones.
What's the Single Biggest Hurdle in Claims Data Analytics?
Hands down, the toughest part is getting the data quality and standardization right. Raw claims data is a mess. It comes in from all over the place, full of inconsistencies, missing information, and formats that don’t play well together. A huge chunk of any project is just spent wrestling this data into a clean, usable state before you can even think about analysis.
This is exactly why a common data model is so important. Getting your source data into the OMOP CDM is the best way to create a dataset you can actually trust for research. But, and it's a big but, this process requires someone who really knows their way around medical vocabularies like ICD-10, CPT, and SNOMED CT.
The real bottleneck is almost always vocabulary mapping. Trying to manually connect all the different source codes to the right standard concepts is incredibly slow and full of potential for error. This is where automated tools make a world of difference; they cut down on the time and specialized knowledge needed for this critical first step.
How Is Claims Data Different from EHR Data?
Think of them as two sides of the same coin, each giving you a different view of a patient's story. Claims data gives you the long view-a comprehensive history of every billed interaction a patient has had, even across different hospitals or clinics. It's fantastic for tracking diagnoses and procedures over a long period.
But it's not very deep. EHR data is where you find the rich clinical details: lab results, vital signs, doctors' notes, and so on. The problem is that this information is usually trapped within one health system's records. The magic happens when you can bring them both together, and that's often where the OMOP CDM comes in, acting as the bridge to create one unified patient record.
What Skills Really Matter for a Claims Data Analyst?
A great claims data analyst is a bit of a hybrid. You need solid technical chops, but you also need to understand the healthcare world. On the tech side, you absolutely have to be comfortable with SQL, Python or R, and the whole ETL process to manage and shape massive datasets.
Just as critical, though, is having deep healthcare domain knowledge. You need to get the business of healthcare-things like revenue cycles, payer rules, and the subtle differences between medical vocabularies. As the field moves toward standardization, knowing your way around a data model like OMOP is becoming a must-have for any serious role.
A practical tip here is to use an SDK to make vocabulary lookups less of a chore, freeing you up for the actual analysis. For example, grabbing a concept from the OMOP vocabulary using the OMOPHub SDK is pretty simple:
# A simple search using the OMOPHub Python SDK
from omophub.client import Client

# Initialize client using an environment variable for the API key
client = Client()

# Search for concepts related to 'myocardial infarction'
concepts = client.search(query="myocardial infarction", vocabulary_id=["SNOMED"])
for concept in concepts:
    print(f"ID: {concept.concept_id}, Name: {concept.concept_name}")
You can find more Python code examples in the official OMOPHub SDK repository on GitHub. It's this mix of technical ability and industry insight that allows an analyst to turn a business question into an answer that actually means something.
Stop wrestling with vocabulary databases and start building faster. OMOPHub provides instant, developer-friendly API access to the complete OHDSI ATHENA vocabularies, eliminating infrastructure headaches so your team can focus on delivering insights. Explore the OMOPHub API today.


