A Practical Guide to Modern Pharmacovigilance
Think of pharmacovigilance as the global neighborhood watch for every medicine on the market. It's the science and practice dedicated to one crucial mission: detecting, understanding, and preventing adverse effects or any other problems related to drugs. This isn't just a one-time check; it's a continuous safety net that spans a medicine's entire lifecycle, from the earliest clinical trials to decades of use by the public.
The Global Watchtower for Medicine Safety
The core idea is to actively monitor and assess a drug's performance long after it has been approved. This ongoing surveillance is absolutely essential because even the most rigorous clinical trials can't tell the whole story.
Clinical trials are, by design, conducted under controlled conditions with carefully selected patient groups. They simply can't predict every risk that might emerge in the real world, where patients have complex medical histories, take multiple medications, and live very different lifestyles. Pharmacovigilance steps in to fill that critical gap, safeguarding public health on a massive scale.
The Core Goals of Pharmacovigilance
At its heart, the work is about building a complete, evolving safety profile for every medicine. This is guided by a few clear goals that ultimately benefit everyone-patients, doctors, and regulators.
- Ensuring Patient Safety: The number one priority is to identify and minimize harm from adverse drug reactions (ADRs). It's all about protecting people from unexpected side effects.
- Improving Public Health Outcomes: By getting a clear picture of a drug's real-world impact, we can promote its safe and effective use, which leads to better health for the entire population.
- Guiding Informed Decision-Making: The data gathered is not just for reports. It directly informs regulatory actions, updates to prescribing information, and the clinical guidance that doctors and pharmacists rely on every day.
Why Its Importance Is Growing
The world of medicine is getting more complex, and so is pharmacovigilance. We're dealing with new biologics, aging populations with multiple chronic conditions, and incredibly intricate global supply chains. Each of these factors introduces new variables and potential risks that demand smarter, more data-driven safety monitoring.
This isn't just an internal industry shift. Regulators worldwide are tightening their standards in response to rising ADRs. High-profile events, like the Vioxx withdrawal in 2004 which impacted 20 million users, put a permanent spotlight on post-market safety. Today, ADRs are responsible for 6-7% of hospital admissions in the US, costing the healthcare system billions each year. You can learn more about the market forces driving pharmacovigilance.
As a result, modern pharmacovigilance is no longer a manual, reactive process. It leans heavily on technology and standardized data to stay ahead of these challenges. For regulators and pharmaceutical companies alike, having a robust surveillance system isn't just a best practice-it's an operational and ethical necessity.
Practical Tips for Getting Started
For any team tasked with building or improving a surveillance system, getting the foundation right is everything.
- Standardize Your Vocabularies: Don't reinvent the wheel. Adopt industry standards like SNOMED CT and RxNorm from day one. A great place to start is the OMOP Common Data Model documentation, which details these crucial standards.
- Automate Where Possible: Manual data mapping and reporting are slow and prone to error. Look for tools that can automate these tasks to ensure you meet tight regulatory deadlines with accuracy. The OMOPHub Python SDK and R SDK are excellent resources for automating workflows tied to standardized vocabularies.
Untangling the Global Web of Pharmacovigilance Regulations
Think of pharmacovigilance compliance not as a single rulebook, but as a complex, overlapping patchwork of global regulations. Every country and region has its own authority setting the standards for drug safety, which can feel like a maze for any organization operating on the world stage. Getting this right is absolutely fundamental to keeping medicines on the market and, more importantly, protecting public health.
The field is dominated by a few key players. In the United States, the Food and Drug Administration (FDA) calls the shots. Across the pond, the European Medicines Agency (EMA) oversees safety for the European Union. And in Japan, that responsibility falls to the Pharmaceuticals and Medical Devices Agency (PMDA). While their specific rules can vary, they all share the same core mission: making sure a drug’s benefits always outweigh its risks.
Bringing Order to Global Safety Standards
To prevent complete regulatory chaos, groups like the International Council for Harmonisation (ICH) step in. The ICH acts as a bridge, bringing together regulators and the pharmaceutical industry to hammer out common standards for everything from clinical trial data to post-market safety reporting. This alignment is what makes global pharmacovigilance possible, ensuring safety data can be shared and understood across borders.
One of the most critical results of this harmonization is the requirement to submit Individual Case Safety Reports (ICSRs). These are the highly detailed, one-by-one reports of an adverse event experienced by a single patient.
When a serious adverse event pops up, the clock starts ticking. Organizations typically have a razor-thin window-often just 15 calendar days-to investigate the event, document it properly, and submit the ICSR to the right authorities. That kind of pressure demands incredibly efficient and accurate data systems.
The Power of Centralized Safety Databases
To handle this flood of information, regulators maintain massive, centralized safety databases. Two of the most important are the FDA's Adverse Event Reporting System (FAERS) and the EMA's EudraVigilance. These platforms are gigantic repositories, collecting millions of ICSRs from patients, doctors, and drug manufacturers.
But these databases aren't just digital filing cabinets; they are active surveillance tools. Regulators and researchers constantly mine this aggregated data to spot safety signals-potential new risks that didn't surface during the original clinical trials. This proactive monitoring allows authorities to act swiftly, whether that means updating a drug's warning label or, in rare cases, pulling it from the market entirely. This entire process hinges on the smooth flow of data, which underscores why interoperability is so crucial, as we explore in our guide on healthcare interoperability solutions.
The sheer volume of data is staggering and speaks to the field's rapid growth. The global pharmacovigilance market is expected to skyrocket to USD 16.87 billion by 2035, a huge leap from its 2025 valuation of USD 9.03 billion. This growth is fueled by a constant stream of new drugs and the expanding capacity of systems like FAERS, which collected over 2.2 million reports in 2023 alone. You can find more details in this report on pharmacovigilance market size and trends.
For anyone working with this data, the takeaway is clear: strict data formatting and standardized vocabularies aren't just best practices-they are non-negotiable requirements for ensuring timely, accurate, and global compliance.
The Art and Science of Signal Detection

If pharmacovigilance is the global watchtower for medicine safety, then signal detection is the guard on duty, scanning the horizon for the first hint of trouble. It’s the proactive, systematic search for the faint whisper of a potential risk hidden within a hurricane of data. The entire point is to spot patterns that might otherwise go completely unnoticed until real harm is done.
In this world, a signal isn't a confirmed problem; it's a hypothesis. It’s a piece of information suggesting a possible causal link between a drug and an adverse event-one that wasn't previously known or was poorly understood. Think of it as an early warning flare shot into the sky, demanding immediate attention and a much deeper investigation.
Historically, this was a very manual and intuitive process. An astute clinician might notice an unusual, recurring side effect in a handful of patients and publish a case report. This kind of sharp-eyed observation is still incredibly valuable for catching very rare or distinct events, but it’s just not built to handle the scale of monitoring millions of patients across the globe.
Shifting from Anecdote to Algorithm
Today, pharmacovigilance has moved far beyond individual case studies. It now leans heavily on powerful statistical methods to sift through the massive datasets from spontaneous reporting systems like FAERS and EudraVigilance. This is where the "science" part of signal detection truly comes alive. Instead of just waiting for individual reports to raise a flag, analysts use algorithms to perform what’s called disproportionality analysis.
The core idea is surprisingly simple: does a specific adverse event show up more often with our drug of interest compared to how often it appears with all other drugs in the database? If the answer is yes, that drug-event pair gets flagged as a potential signal.
This statistical approach empowers safety teams to systematically screen millions of reports, comparing thousands of drugs against thousands of potential adverse events-a task no human could ever accomplish. It transforms the work from a reactive review of case reports into a proactive, data-driven surveillance engine.
To make this work, experts rely on specific statistical metrics to measure the strength of these connections. These metrics are designed to help separate the random statistical noise from a signal that points to a genuine safety issue.
Understanding Key Signal Detection Metrics
Two of the most common metrics you'll encounter in disproportionality analysis are the Proportional Reporting Ratio (PRR) and the Reporting Odds Ratio (ROR). Their formulas might look complex at first glance, but the logic behind them is quite intuitive.
-
Proportional Reporting Ratio (PRR): This metric simply compares the proportion of reports for a specific event with your drug of interest to the proportion of those same events among all other drugs. A PRR that crosses a certain threshold (often set at 2) suggests a potential signal worth looking into.
-
Reporting Odds Ratio (ROR): Similar to the PRR, the ROR calculates the odds of a specific adverse event happening with a particular drug versus the odds of it happening with all other drugs. It’s another way of statistically flagging a disproportionate number of reports.
Let's make this real. Imagine a new drug for hypertension hits the market. Analysts run a disproportionality analysis and find that reports of "acute kidney injury" are three times more frequent for this new drug compared to all other drugs combined. This doesn't prove the drug causes kidney injury. But it absolutely generates a strong signal-one that demands an immediate and thorough clinical investigation.
This is the statistical engine that drives modern drug safety, giving regulators and drug makers the ability to systematically monitor the safety landscape and protect public health on a global scale.
Why Standardized Vocabularies Are Non-Negotiable
Without a common language, safety data is just noise. Imagine trying to build a coherent picture from thousands of doctors, patients, and researchers across the globe reporting side effects in their own words-using local slang, different languages, and wildly varying levels of clinical detail. An effective pharmacovigilance system has to cut through that chaos, and that's where standardized vocabularies come in.
Vocabularies like MedDRA for adverse events, WHODrug for medicinal products, and SNOMED CT for clinical findings create a universal dictionary for health data. They are the bedrock of modern drug safety, ensuring that a report from Tokyo can be accurately aggregated and compared with one from Toronto.
The Real-World Challenge: Terminology Mapping
The real work, the part that separates theory from practice, is a process called terminology mapping. This is the nitty-gritty task of translating messy, unstructured, real-world data into the clean, structured terms needed for analysis.
Think about it. A patient might tell their doctor, "My heart feels like it's racing," or type into a health app, "I've had weird chest flutters all day." Neither of those phrases exists in a clinical database. The job of a pharmacovigilance professional is to map these narrative descriptions to a specific, globally recognized code-in this case, the MedDRA term for 'Palpitations'. This translation is absolutely essential for consistent data analysis.
This process isn't just a technicality; it's a public health imperative. The North American pharmacovigilance ecosystem, valued at USD 2.09 billion in 2025, is built on the FDA's rigorous reporting framework, which pulls in over 1.8 million reports every year. With adverse drug reactions ranking as the fourth leading cause of death in the US, getting the data right is non-negotiable.
Making sense of this complexity often requires advanced techniques. For instance, digging into tools like Named Entity Recognition (NLP) is crucial for automatically extracting and classifying key information from all that unstructured text.
Moving Beyond Clunky, Local Databases
For years, organizations managed these massive vocabularies with complex, locally-hosted databases. This old-school approach is slow, expensive, and a nightmare to maintain. Standards like MedDRA are updated twice a year, and keeping a local system perfectly synchronized is a huge operational burden that constantly introduces risk.
A modern, API-driven approach changes the game. Instead of wrestling with a cumbersome local copy, teams can programmatically query up-to-date vocabularies through a service. This lets them build robust, automated data pipelines that stay current with every new release, no manual intervention required. We get into the weeds of how this works in our deep dive on https://omophub.com/blog/semantic-mapping.
This OMOPHub dashboard shows how teams can access and manage a variety of standardized vocabularies through a single, unified interface.
By providing programmatic access, platforms like this remove the infrastructure headache entirely. Your team gets to focus on building value, not just managing data.
Tips for Vocabulary-Driven Workflows
Building a strong vocabulary strategy is foundational for any drug safety system that needs to scale. Here are a few practical tips to get you started:
- Centralize Vocabulary Access: Stop letting different teams or systems use their own versions of a vocabulary. A single, API-driven source of truth is the only way to guarantee consistency across all your pharmacovigilance work.
- Automate Mapping in Your ETL Pipelines: Manually mapping terms is a recipe for failure at scale. Integrate vocabulary API calls directly into your Extract, Transform, Load (ETL) processes to standardize data the moment it enters your system.
- Document Your Mapping Logic: Always keep a clear, version-controlled record of why certain free-text terms are mapped to specific codes. This audit trail is critical for regulatory inspections and makes your mapping rules transparent and defensible.
Building a Surveillance Study on the OMOP CDM
If standardized vocabularies are the common language of pharmacovigilance, the OMOP Common Data Model (CDM) is the grammar that holds it all together. It’s a framework that organizes messy, disparate health data into a consistent, predictable structure. Think of it as a universal translator for EHRs, claims data, and patient registries, turning a chaotic mix of formats into a powerful, analysis-ready resource.
So, how do we actually use this to build a real-world drug safety study? Let's walk through the steps.
The journey always begins with the Extract, Transform, Load (ETL) process. This is the heavy lifting where you map your raw source data-with all its inconsistencies and unstructured notes-into the clean, standardized tables of the OMOP CDM.
For example, a prescription from an EHR system needs to be carefully mapped to fit into the DRUG_EXPOSURE table. A diagnosis code from a billing claim finds its proper home in the CONDITION_OCCURRENCE table. This mapping is easily the most critical and labor-intensive part of adopting OMOP, but it's the very foundation that makes large-scale, reproducible research possible.
If you're just getting started with the framework, our in-depth guide to the OMOP data model is the perfect place to build your understanding.
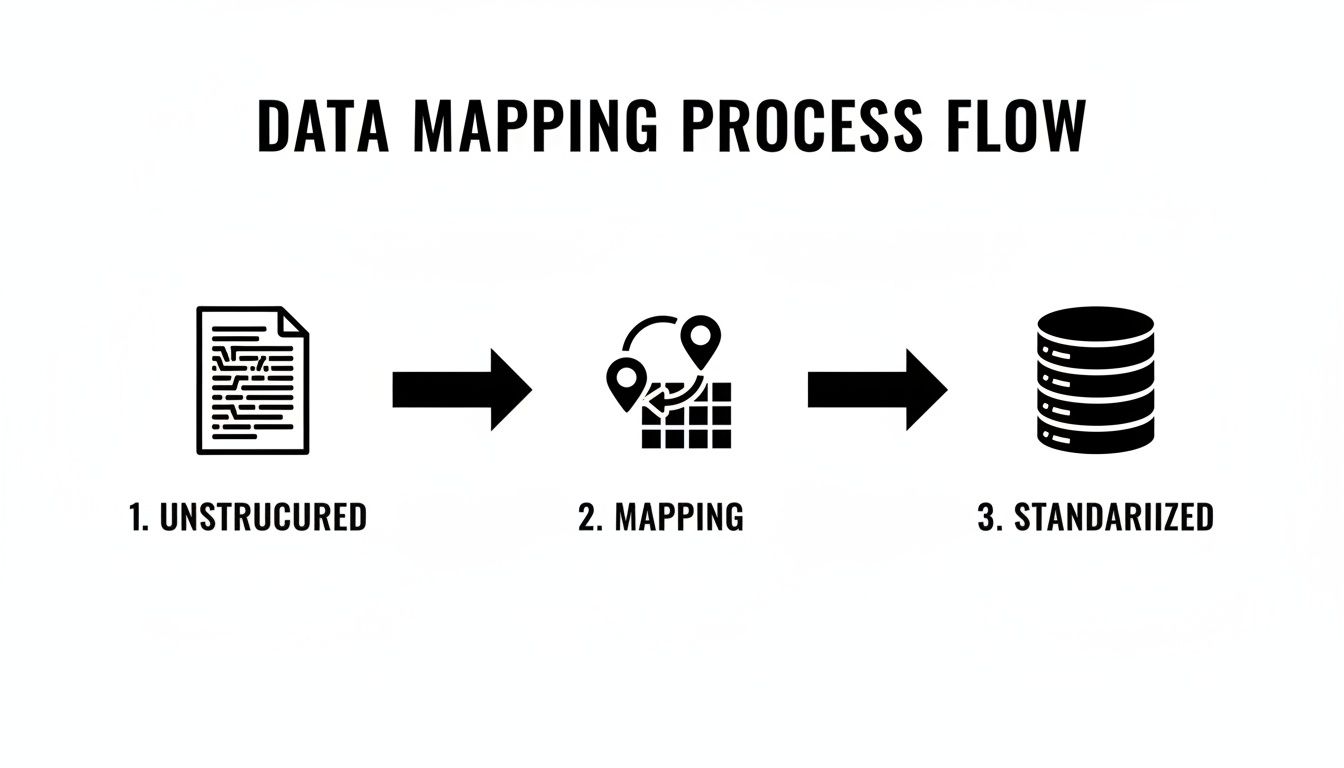
This diagram neatly captures that essential journey from raw, variable information to a structured, queryable database-the core principle behind the entire OMOP ETL process.
Defining Your Study Cohorts
Once your data is neatly organized within the OMOP CDM, the real analysis can begin. The first step is defining your patient groups, or cohorts. A cohort is simply a group of people who share a specific set of characteristics over a defined period.
In a typical drug safety study, you'll need to define at least three distinct groups:
- The Target Cohort: These are the patients exposed to the drug you’re investigating. A simple definition could be: "All new users of Drug X with at least 365 days of prior observation."
- The Comparator Cohort: This group serves as a baseline for comparison. It might be new users of a different drug in the same therapeutic class or even a group from the general patient population.
- The Outcome Cohort: This includes any patient who has experienced the adverse event you're looking for, such as "patients with a first-time diagnosis of acute liver injury."
By comparing how often the outcome occurs in the target cohort versus the comparator cohort, researchers can start to put real numbers behind a drug's potential risk.
Speeding Up Phenotype Algorithms with APIs
Defining an outcome like "acute liver injury" isn't as simple as it sounds. It requires building a phenotype algorithm-a detailed, computable definition that uses specific codes from standardized vocabularies to accurately identify patients with that condition.
Doing this manually is a nightmare. You'd have to sift through vocabulary browsers, trying to find every single code related to liver injury. It's tedious, time-consuming, and almost guaranteed to be incomplete.
This is where a modern vocabulary API becomes a game-changer. Instead of manual lookups, you can programmatically find every relevant concept with just a few lines of code.
Imagine you’re building a phenotype for hepatitis. With an API, you can make a single call to find every descendant concept of 'Hepatitis' in SNOMED CT. In seconds, you get a comprehensive list of hundreds of specific codes-from 'Acute viral hepatitis A' to 'Chronic alcoholic hepatitis'-creating a far more robust and accurate cohort definition than you could ever build by hand.
This programmatic approach isn't just about speed. It makes your definitions reproducible, version-controlled, and easy to update as vocabularies evolve.
Mapping Vocabulary Concepts with the OMOPHub Python SDK
This example shows how to use the OMOPHub Python SDK to programmatically find all descendant concepts for 'Hepatitis' to build a comprehensive phenotype algorithm. You can find detailed usage and more examples in the SDK documentation.
| Action | Python Code Example (using omophub-python SDK) |
|---|---|
| Import the SDK | from omophub import OMOPHub |
| Authenticate | omophub_client = OMOPHub(api_key="your_api_key_here") |
| Define the Concept | concept_id = 439627 # Concept ID for 'Hepatitis' |
| Find All Descendants | descendants = omophub_client.vocabulary.get_descendants(vocabulary_id="SNOMED", concept_id=concept_id) |
| Print Results | print(f"Found {len(descendants)} descendant concepts for Hepatitis.") |
This simple script automates what would take an expert hours or even days to do manually, ensuring no relevant codes are missed.
Operational Tips for Your OMOP Study
As you start building your own surveillance studies, a few practical considerations can save you a world of headaches down the line.
- Start with a Clear Protocol. Before a single line of code is written, lock down your research question, cohort definitions, and analysis plan. A detailed protocol is your roadmap and will prevent countless hours of rework.
- Automate with Official SDKs. Don't reinvent the wheel. Tools like the OMOPHub Python SDK and its R counterpart provide ready-made functions for interacting with vocabularies, which dramatically accelerates phenotype development.
- Always Validate Your Phenotypes. Never assume an algorithm is perfect on the first try. Review a sample of patient records to confirm that the codes you’ve selected are actually identifying the condition you’re interested in. You can dig into the specifics of concept relationships to refine your logic on the OMOPHub documentation site.
Future-Proofing Your Pharmacovigilance Operations
A modern pharmacovigilance system is built on far more than just powerful analytics-it demands exceptional operational discipline. Real success comes from a foundation of trust, transparency, and a constant readiness for both regulatory scrutiny and technological change. This means we're not just building systems for today; we're designing them to be resilient for whatever comes next.
At the very heart of this is the uncompromising management of data integrity and patient privacy. Regulations like HIPAA in the U.S. and GDPR in Europe aren't just guidelines; they're the law. Every piece of data has to be handled with incredible care, and every step of an analysis must be completely auditable. This is why features like immutable data logs are so important-they create a permanent, unchangeable record of every action taken.
Ensuring Compliance Through Meticulous Versioning
Another absolutely critical practice is meticulous vocabulary versioning. As we've seen, terminologies like MedDRA and SNOMED CT are constantly being updated. A truly robust pharmacovigilance system has to track precisely which version of a vocabulary was active during a specific analysis.
Without this, study reproducibility completely falls apart. An analysis you run in January could give you a different answer than the same exact query run in July, all because the underlying vocabulary changed. Proper versioning ensures every result can be traced back to its origin, a non-negotiable for regulatory submissions and scientific integrity.
The Next Frontier: AI and Machine Learning
Looking ahead, artificial intelligence and machine learning are poised to fundamentally change how we approach pharmacovigilance. We're moving past the hype and into real-world applications that automate tasks and give safety teams new superpowers. For anyone looking to stay ahead, adopting solutions like Intelligent Document Processing can make a massive difference in how you handle incoming safety data.
We're already seeing a huge impact in a few key areas:
- Automated Case Processing: Natural Language Processing (NLP) models can now read unstructured case reports and pull out the critical information, dramatically cutting down on manual data entry.
- Predictive Signal Detection: More advanced ML models can spot complex patterns in the data, helping us forecast potential safety issues long before they'd show up using traditional methods.
To really capitalize on these advancements, you need a flexible, API-driven architecture. This kind of setup separates your data sources from your analytical tools, making it possible to plug in new technologies without having to rip out and replace your entire system. It's how you prepare your organization for the next generation of pharmacovigilance challenges and opportunities.
Common Questions in Pharmacovigilance
When you're in the trenches of pharmacovigilance work, a lot of practical questions come up. Whether you're a data scientist, a developer building tools, or a researcher designing a study, you'll eventually hit these common hurdles. Let's walk through some of the most frequent ones to clarify the best way forward.
What's the Real Difference Between an AE and an ADR?
This is a classic-and absolutely critical-distinction. Think of an Adverse Event (AE) as anything medically undesirable that happens to a patient who has taken a drug. It doesn't matter what caused it. A patient in a clinical trial could fall and break their arm or catch a common cold; both are considered AEs because they happened during the study period.
An Adverse Drug Reaction (ADR) is a subset of AEs where you actually suspect the drug is the culprit. The key difference is the suspicion of a causal link. So, while every ADR is an AE, most AEs are not ADRs. Sorting one from the other is the first step in any real safety analysis.
How Do You Handle Vocabulary Versions in a Study Spanning Several Years?
This is a huge deal for ensuring your research is reproducible. A long-term study will almost certainly see multiple updates to core vocabularies like MedDRA or SNOMED CT. If you aren't careful, the goalposts can move mid-study.
The best practice is straightforward but non-negotiable: log the exact vocabulary version used for every single analysis.
When you run an analysis, you have to create a permanent record tying your results to that specific vocabulary snapshot. This is the only way to ensure someone can reproduce your work five years from now-a cornerstone of scientific integrity and a must-have for any regulatory submission.
What's the Best Way to Define a Phenotype Algorithm?
Creating a solid phenotype algorithm-a rule to identify patients with a specific condition-is more of an art than a science, but there are some core principles. Simply picking one diagnosis code is almost never enough.
- Build a Concept Set: Instead of just one code for "myocardial infarction," pull together a comprehensive set. This should include related diagnosis codes, key lab results (like troponin levels), and relevant procedures (like a cardiac catheterization).
- Use the Vocabulary Hierarchy: A good vocabulary is structured like a tree. You can programmatically grab a high-level term and all of its descendants to cast a wider, more accurate net. This is where an API-driven tool really pays off.
- Get Clinical Validation: This is the most important step. Have a clinician review a sample of patient charts flagged by your algorithm. This reality check is the only way to know if your algorithm is truly identifying the right patients.
Practical Tips for Developers
For developers building the tools and pipelines for pharmacovigilance, the game is all about efficiency, accuracy, and auditability.
- Automate Your Vocabulary Lookups: Don't rely on manual searches or local file management. Build API calls directly into your ETL and analysis scripts. It not only prevents human error but also ensures you're using up-to-date terminologies. For some hands-on examples, take a look at the code in the OMOPHub Python SDK.
- Build in Audit Trails from Day One: Every single action that touches the data needs to be logged-from the initial data transformation to a simple vocabulary query. Having an immutable log isn't just a "nice-to-have"; it's essential for compliance and for figuring out what went wrong when an issue inevitably pops up. You can find more on building these kinds of robust data pipelines in the OMOPHub documentation.
Ready to stop wrestling with local vocabulary databases? With OMOPHub, your team gets immediate, compliant API access to OHDSI ATHENA vocabularies. This lets you build faster and with far more confidence. See how our platform can supercharge your pharmacovigilance workflows at https://omophub.com.


