A Guide to Healthcare Analytics From Raw Data to Real Insights
Healthcare analytics is, at its heart, the practice of turning vast amounts of health-related data into insights that actually matter-improving patient outcomes, lowering costs, and making healthcare operations run more smoothly. It’s the bridge between raw information from electronic health records (EHRs) and patient wearables, and the actionable intelligence needed to move from reactive treatment to proactive, data-driven care.
Unlocking Insights From Health Data
Think of healthcare analytics less like a spreadsheet and more like a modern diagnostic toolkit for the entire healthcare system. For years, valuable clinical and operational data was stuck in silos, fragmented across systems that didn't talk to each other. It was like trying to assemble a puzzle with pieces from a dozen different boxes. This data chaos made it nearly impossible to see the bigger picture of patient health or system efficiency.
Today, we can pull together information from a dizzying array of sources-EHRs, insurance claims, pharmacy records, and even the data streaming from a patient's fitness tracker. The real challenge isn't just getting the data; it's transforming this messy, disconnected flood of information into a clear, unified view. This is where the real work of healthcare analytics begins.
The Driving Forces Behind Modern Analytics
The field is exploding for a couple of key reasons. First, the sheer volume of digital health data being generated is immense. Second, the entire industry is pivoting from old-school fee-for-service models to value-based care. In this new world, providers are rewarded for patient outcomes, not just the volume of procedures they perform. This creates a powerful financial and clinical incentive to deeply understand patient populations and find the most effective care pathways.
The growth is staggering. The healthcare analytics market is projected to surge by USD 81.28 billion between 2024 and 2029, climbing at a compound annual growth rate of 25%. This isn't just incremental change; it’s a seismic shift showing how central analytics has become to making sense of massive datasets and improving how healthcare is delivered.
At its core, healthcare analytics is about finding the signal in the noise. It helps answer critical questions like: Which patients are at the highest risk for hospital readmission? How can we reduce surgical supply costs without compromising quality? Where are the bottlenecks in our patient scheduling process?
The Need for a Universal Language
To answer these kinds of questions reliably and at scale, organizations need a standardized approach. Without a common data structure, trying to compare patient outcomes between two different hospitals is like comparing apples and oranges. This is precisely why frameworks like the OMOP Common Data Model (CDM) have become so crucial.
The OMOP CDM acts as a universal translator for health data. It takes all the different local formats, codes, and terminologies and maps them into a single, consistent structure. This provides the bedrock for reliable, reproducible, and scalable analysis across different institutions and even countries. By establishing this common language, we unlock the true potential of healthcare analytics to generate insights that can improve care for everyone. For a deeper dive, you can explore comprehensive resources on Healthcare Data Analytics that cover these foundational concepts in more detail.
Building the Healthcare Data Pipeline
Powerful healthcare analytics doesn't just happen. It’s the direct result of a carefully designed and executed data pipeline-a systematic journey that turns raw, chaotic data into clean, structured information ready for analysis.
Think of it like building a sophisticated water filtration system. You start with murky water collected from dozens of different streams (your data sources), and the goal is to produce perfectly clean, standardized water (your analysis-ready dataset).
First up is data ingestion. This is where we gather data from a vast array of sources. We're talking about structured data from Electronic Health Records (EHRs) like Epic or Cerner, financial details from claims databases, and even unstructured text like clinician's notes or real-time data streaming from patient wearables. Each source has its own format, its own coding system, and its own quirks, which makes this initial step a real challenge.
The diagram below gives you a bird's-eye view of how this raw data is refined into valuable insights.
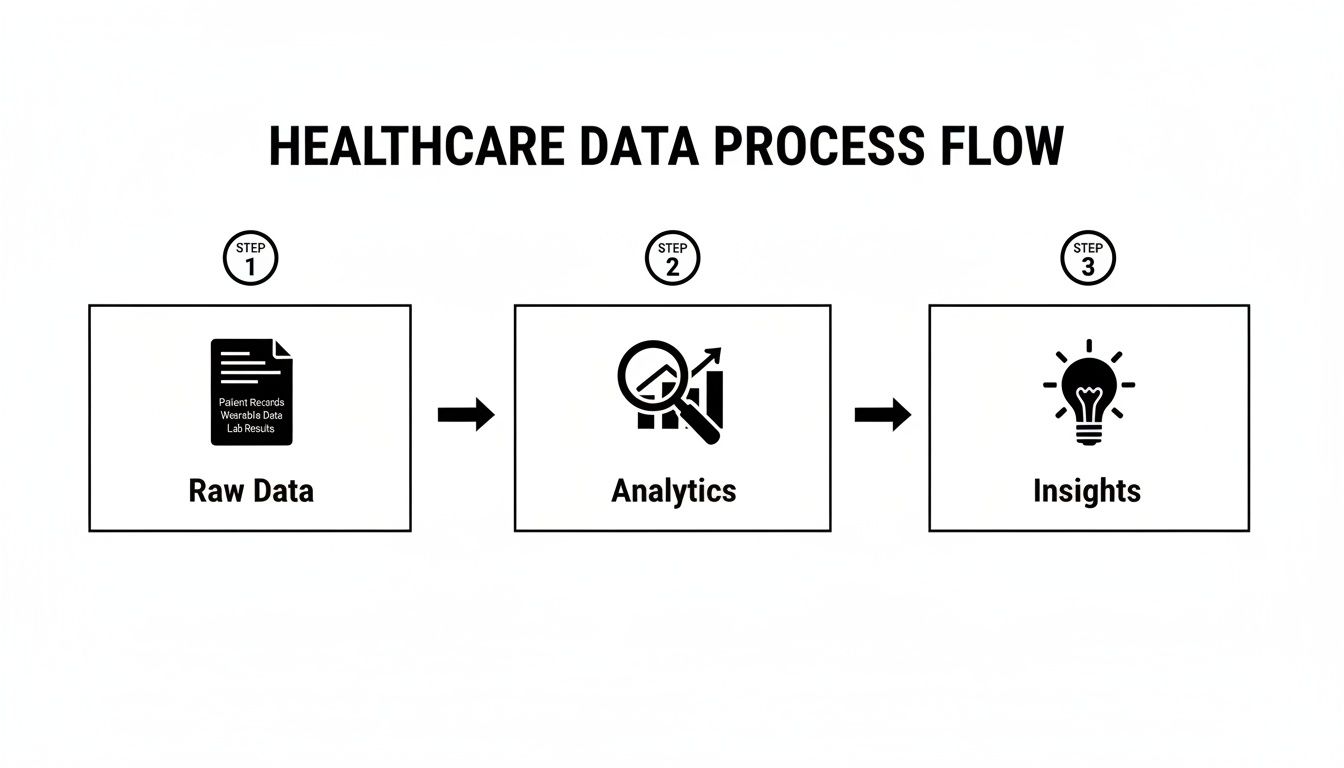
As you can see, raw data holds very little value on its own. It only becomes useful after it’s been processed through a structured workflow that produces actionable intelligence.
The Critical ETL Process
Once the data is collected, it moves into the ETL (Extract, Transform, Load) process. This is the non-negotiable engine room of the pipeline where all the heavy lifting happens. We extract the raw data, transform it by cleaning up errors and restructuring it for consistency, and then load it into a central repository, like a data warehouse.
This stage is absolutely crucial because raw healthcare data is notoriously messy. It's often riddled with duplicates, missing values, and weird inconsistencies that would completely invalidate any analysis if left unchecked.
Standardizing Data with the OMOP CDM
At the heart of any modern healthcare analytics pipeline is standardization, and that’s where the OMOP Common Data Model (CDM) steps in.
Imagine you have patient records from hospitals in three different countries. Each one is written in a different language and uses its own local medical terminology. Trying to analyze them all together would be a nightmare.
The OMOP CDM acts as a universal translator. It provides a single, consistent structure and vocabulary for all those disparate data sources. By mapping everything to this common model, we ensure that a diagnosis of "Type 2 Diabetes" means the exact same thing whether it comes from a claims database in the U.S. or an EHR in Europe. You can dive deeper into how this works by exploring the OMOP data model in our detailed guide.
It's this rigorous standardization that makes large-scale, multi-site research and analytics not just possible, but genuinely reliable.
Automating Vocabulary Mapping
A huge part of converting data to the OMOP CDM is vocabulary mapping. This is the intricate process of connecting local, source-specific medical codes (like a hospital's internal lab test codes) to standard terminologies like SNOMED CT for conditions or LOINC for lab results.
Historically, this has been a painful, mind-numbing manual task that could bog down data teams for weeks, or even months, for just one data source.
Fortunately, modern tools are here to automate this complex step. Instead of slogging through spreadsheets, developers can now use an API to programmatically find the correct standard concepts.
Pro Tip: Automate your vocabulary mapping with a dedicated SDK. It will save you hundreds of hours, slash the risk of human error, and produce much higher-quality data. For detailed code examples and setup instructions, refer to the official OMOPHub documentation.
For instance, the omophub-python SDK from OMOPHub simplifies this process down to just a few lines of code.
import os
from omophub.client import OmophubClient

# Initialize the client with your API key
client = OmophubClient(api_key=os.environ.get("OMOPHUB_API_KEY"))

# Search for the standard SNOMED CT concept for "Diabetes mellitus"
concepts = client.vocabulary.search_concepts(
  query="Diabetes mellitus",
  vocabulary_id=["SNOMED"]
)

# Print the top result's concept ID and name
if concepts.concepts:
  top_concept = concepts.concepts[0]
  print(f"Concept ID: {top_concept.concept_id}, Name: {top_concept.concept_name}")
Using a tool like this, a task that once demanded weeks of manual labor can be done with a simple API call. This kind of automation is essential for building scalable and maintainable healthcare analytics pipelines, freeing up your team to focus on generating insights instead of just wrestling with data prep.
Where the Rubber Meets the Road: Real-World Applications
Once your data pipeline is clean and standardized, the abstract work of healthcare analytics gives way to powerful, real-world applications. This is where the technical "how" transforms into the impactful "why." We're moving beyond the plumbing to see how turning structured data into actionable intelligence directly improves patient care and makes hospitals run better.

These aren't just futuristic ideas; health systems are deploying these tools today to solve very real problems. The single most important foundation for all of it? Standardized data. Without a common structure like the OMOP CDM, any attempt at large-scale analysis becomes unreliable and riddled with inconsistencies, dooming projects to be one-off efforts with limited impact.
Driving Population Health Management
Population health management is a fundamental shift in perspective. Instead of just treating sick individuals who walk through the door, it’s about proactively managing the health of an entire community. Healthcare analytics is the engine that makes this possible, giving providers the tools to spot at-risk groups and step in before problems become crises.
For example, a health system can comb through its EHR and claims data to find diabetic patients who are most likely to land back in the hospital within 30 days of discharge. By flagging key risk factors-like erratic A1c tests, a history of missed appointments, or specific medication patterns-care managers can focus their efforts. They can target this group with personalized education, follow-up calls, and support to head off a costly and disruptive readmission.
This kind of proactive strategy is the very definition of modern, value-based care.
Tip: A core lesson from population health analytics is that a small fraction of patients often drives a huge percentage of healthcare costs. By identifying these high-risk, high-cost individuals and managing their care more effectively, organizations can see massive improvements in both patient outcomes and their own financial stability.
Accelerating Clinical Research and Discovery
Traditionally, clinical research has been a painfully slow and expensive marathon. Standardizing data changes the game entirely by creating a massive, cohesive pool of research-ready information, dramatically shortening the timeline from a new idea to a meaningful discovery.
With data from multiple hospitals all mapped to the OMOP CDM, researchers can run large-scale observational studies in a fraction of the time it used to take. They can quickly assess how a new drug performs in the real world across diverse groups of people or uncover rare side effects that only show up when you look at data from tens of thousands of patients. This creates a feedback loop, allowing for rapid evidence generation that sharpens clinical guidelines and improves care for everyone.
Powering Predictive Modeling for Proactive Care
Predictive modeling is easily one of the most exciting frontiers in healthcare analytics. These models dig through historical data to forecast future events, letting clinical teams get ahead of problems instead of just reacting to them. The growth here is staggering; predictive analytics is expanding at a 23.90% CAGR, while population health management is growing at 25.10% through 2031. This isn't just hype-some hospitals are already using these tools to cut readmissions by as much as 18%. You can understand the expanding market for healthcare analytics by exploring more of the data behind this trend.
Here are a few practical examples of predictive modeling in action:
- Sepsis Prediction: Algorithms can monitor patients in the ICU and flag those at high risk of developing sepsis, giving clinicians a heads-up hours before they might otherwise notice.
- Disease Outbreak Forecasting: Public health data can be analyzed to predict the spread of infectious diseases like the flu, helping hospitals prepare for surges.
- No-Show Predictions: By analyzing patient history and demographics, a clinic can predict who is likely to miss an appointment, allowing schedulers to double-book intelligently or send targeted reminders.
These models are often built directly into clinical workflows, providing real-time alerts that guide decisions at the point of care. If you want to dig deeper, our guide on what clinical decision support is explains how these integrations work. Ultimately, these use cases prove that a solid analytics foundation isn't just a technical achievement-it's an essential asset for delivering smarter, safer, and more effective healthcare.
Designing Your Modern Healthcare Analytics Tech Stack
Building a truly effective healthcare analytics platform isn't just about having data; it's about having the right architecture. Think of it as a blueprint for turning raw, messy clinical data into a strategic asset that can drive everything from daily operational reports to groundbreaking predictive models.
The journey starts with getting the data in the door, which is the job of ETL (Extract, Transform, Load) and Data Orchestration. This is the heavy lifting. Tools like dbt and Apache Airflow are the workhorses here, creating automated and reliable data pipelines. They handle the complex choreography of pulling data from sources like EHRs, cleaning and standardizing it, and then loading it into a central repository where the real analysis can begin.
The Foundation: Your Data Warehouse
Once the data is cleaned and prepped, it needs a place to live. That's the role of a modern Data Warehouse. Cloud-native platforms like Snowflake or Google BigQuery were built from the ground up to handle the sheer scale and complexity of healthcare data.
These systems are engineered for speed, letting analysts and data scientists run complex queries across billions of clinical and claims records without the frustrating bottlenecks of older, on-premise databases. A key advantage is their ability to separate storage from compute, giving you the flexibility to scale resources up for a massive research query and then scale back down to save costs. It's this elasticity that makes them a cost-effective foundation for your entire analytics operation.
A Smarter Approach to Vocabulary Management
One of the most critical-and frankly, most underestimated-parts of this whole process is Vocabulary Management. To standardize your data to the OMOP Common Data Model, you have to map all your local, source-specific codes to standard terminologies like SNOMED CT, LOINC, and RxNorm. For years, the only real option was to download the entire OHDSI ATHENA vocabulary database and host it yourself. This is a massive engineering headache.
Pro Tip: Hosting a local vocabulary database forces your team to become infrastructure managers. It's a constant, high-maintenance cycle of downloading massive files, managing database updates, and troubleshooting performance, pulling hundreds of engineering hours away from actual analytics work. An API-first approach avoids this entirely.
This is where a modern, API-first approach completely changes the game. Instead of building and maintaining your own vocabulary server, you can plug a managed service directly into your ETL pipelines. Services like OMOPHub give you instant API access to the latest ATHENA vocabularies, completely eliminating the infrastructure burden. This shift lets your team focus on what they do best: building value, not managing databases. You can dive deeper into this topic in our article on healthcare interoperability solutions.
To make this even easier, dedicated SDKs are available. The screenshot below shows just how simple it is to use the official omophub-python SDK to streamline vocabulary lookups into simple function calls.
This example shows how a developer can find standard concepts quickly, without ever having to write complex SQL or touch a database. It’s a huge accelerator for ETL development.
Practical Tips for Vocabulary Integration
- Prioritize API-First Tools: Look for solutions with SDKs for your team’s preferred languages, like Python or R. It will dramatically cut down on integration time. The omophub-python and omophub-R repositories are great examples.
- Check for Automated Updates: A major benefit of a managed service is that vocabulary versions are handled for you. Make sure any tool you choose automatically syncs with official ATHENA releases to keep your data quality high.
- Verify Performance: Your vocabulary service has to be fast enough for both massive ETL jobs and interactive lookups. Look for services with documented, low-latency response times. You can find detailed guidance in the official OMOPHub documentation.
Completing the Stack: Visualization and Machine Learning
The final pieces of the stack are where data truly becomes insight. Business Intelligence (BI) tools such as Tableau or Power BI connect directly to your data warehouse, empowering users to build interactive dashboards and compelling visualizations. These tools make complex data accessible to clinicians and administrators who need to track performance metrics and spot trends.
Finally, for the most advanced work, you need Machine Learning (ML) frameworks. Libraries like PyTorch and TensorFlow give data scientists the power to build sophisticated algorithms that can predict patient risk, forecast disease outbreaks, or optimize hospital workflows. When all these components work together, you have a complete, end-to-end tech stack that can support the full spectrum of modern healthcare analytics.
Navigating Governance, Privacy, and Performance Challenges
Building a powerful healthcare analytics platform is one thing; making it secure, compliant, and fast is another challenge altogether. The incredible value of the insights you can generate rests entirely on a foundation of trust. If you get governance, privacy, or performance wrong, it’s not just a technical hiccup-it’s a recipe for security breaches, compliance failures, and stalled projects.
The stakes couldn't be higher. In 2024, North America commands over 39.3% of the global healthcare analytics market, a testament to the region's aggressive adoption of data-driven healthcare. But this growth comes with immense risk. The average cost of a single healthcare data breach has soared to $10.1 million in 2024, highlighting the absolute necessity of getting security right from day one.
Building a Bulletproof Data Governance Framework
Think of data governance as the constitution for your data. It’s not about locking everything down; it’s about creating clear rules to ensure data is accurate, consistent, and used responsibly. This starts with establishing unambiguous ownership and accountability for every single dataset.
A truly effective governance framework has a few non-negotiable components:
- Data Lineage: You need to be able to trace every piece of data from its original source all the way to a final report or dashboard. This is your lifeline for debugging issues and, more importantly, for building trust in the numbers.
- Automated Quality Checks: Don't rely on manual spot-checks. Build automated validation rules directly into your data pipelines to catch inconsistencies, duplicates, and missing values before they ever contaminate your analysis.
- Clear Data Stewardship: Assign "stewards"-specific people or teams-to be the guardians of key data domains (like clinical, claims, or labs). They become the definitive experts responsible for defining, protecting, and vouching for the quality of their data.
Mastering Privacy and Security Mandates
In healthcare, privacy is the law. Period. Compliance with regulations like HIPAA in the U.S. and GDPR in Europe isn't optional-it’s a fundamental requirement for any analytics workflow that touches patient data. The entire game is about extracting valuable insights without ever compromising patient confidentiality.
To properly handle sensitive patient information, you need to develop and enforce robust privacy policies that directly inform your technical security controls.
Security Tip: A cornerstone of modern security is the immutable audit trail. This is a tamper-proof log that records every action performed on the data: who accessed it, what they did, and precisely when. Having an unchangeable record is absolutely essential for forensic investigations and for proving compliance during an audit.
Other critical steps include using sophisticated de-identification techniques to strip out personally identifiable information (PII) before analysis begins, alongside strict, role-based access controls that guarantee users only see the data they absolutely need to do their jobs.
Overcoming Performance and Scalability Bottlenecks
The final piece of the puzzle is performance. Running complex queries against massive clinical datasets can bring even the most powerful infrastructure to its knees. Your challenge is to deliver insights quickly enough to be useful, whether it's for a doctor reviewing an interactive dashboard or a massive ETL job processing millions of records.
Vocabulary lookups during an OMOP CDM conversion are a classic performance killer. Teams that try to self-host a vocabulary server almost always run into slow, inconsistent response times that create a bottleneck for the entire workflow.
A much smarter approach is to use a globally distributed service that relies on intelligent caching. This kind of architecture can deliver the sub-50ms API response times required for both snappy interactive analytics and high-throughput data processing. Achieving this level of performance with a traditional, self-hosted setup is next to impossible, making it a crucial consideration for any organization serious about building a scalable healthcare analytics platform.
Your First Steps in Healthcare Analytics
Getting started with a healthcare analytics project can feel like you're standing at the base of a mountain. It’s easy to get overwhelmed. The trick is to take a phased approach, focusing on small, tangible wins that build momentum and prove value quickly. This isn't about solving every problem at once; it's about turning a single, well-chosen concept into a working reality.
The most critical first step? Frame a very specific question. It’s tempting to chase big, vague goals like "improving patient outcomes," but that’s a recipe for failure. You need to narrow your focus to a concrete problem you can actually solve.
A great starting point might be something like: "Which of our diabetic patients are at the highest risk of hospital readmission within 30 days?" This question is specific, measurable, and points directly to the data you'll need.
Start Small to Scale Smart
With a clear question in hand, you can pinpoint the exact data you need to answer it. For our readmission example, you’d likely need specific fields from your EHR, claims data to track post-discharge care, and maybe even pharmacy records to check on medication adherence. The key is to resist the urge to integrate every single data source you have. Just grab what you need for this one use case.
Now, you're ready to design a small, manageable pilot project. The goal is to build a focused ETL pipeline that maps only the necessary data to the OMOP Common Data Model. By keeping the scope tight, you can work through the inevitable complexities of data standardization on a much smaller scale. This first project becomes a valuable, reusable template for everything that comes next.
Key Tip: Don't boil the ocean. The secret to success in healthcare analytics is to pick one project, deliver real value, and use that win to build momentum and get buy-in for whatever comes next.
Accelerate Your Timeline with Managed Services
One of the biggest mistakes teams make is trying to build their entire tech stack from the ground up. This is a massive drain on resources, especially for something as complex as vocabulary management. Building and maintaining your own local vocabulary server can easily eat up months of engineering time before a single analysis is even run.
This is where managed API services can be a game-changer. Instead of building, you can plug into a ready-made solution. For instance, using a platform like OMOPHub gives your team instant access to the latest OHDSI ATHENA vocabularies. This means you can integrate powerful vocabulary mapping into your ETL pipeline in minutes, not months.
You can check out the various API endpoints and what they can do in the detailed OMOPHub documentation. This approach lets you sidestep major infrastructure headaches and gives you a clear, manageable plan to finally get your healthcare analytics journey off the ground.
Common Questions We Hear
Getting started with healthcare analytics often brings up a lot of questions. We've compiled answers to some of the most frequent ones we hear from teams who are just diving in.
Analytics vs. Bioinformatics: What's the Difference?
This is a big one. Think of it this way: healthcare analytics focuses on the data generated from the process of delivering care. It uses clinical and operational data-things like EHR records, billing codes, and insurance claims-to make the healthcare system work better. The goal is to improve hospital efficiency, patient outcomes, and population health.
Bioinformatics, on the other hand, digs into the raw biological data itself. It's all about analyzing things like genomic sequences or protein structures to fuel research and new drug discovery. While they can and do intersect, analytics is much closer to the immediate business and clinical side of healthcare.
How Long Does an OMOP Implementation Really Take?
There's no single answer here, as it really depends on the scale of your project. For a small pilot project, maybe pulling from a single, fairly clean data source, you could be looking at 3 to 6 months of focused work.
But for a full-blown enterprise implementation that needs to pull in and harmonize data from multiple messy EHRs and claims systems? That can easily stretch to a year or more. The biggest time sinks are almost always the infrastructure setup and vocabulary management. This is where using a managed service, like the vocabulary APIs described in the OMOPHub documentation, can literally shave months off your timeline.
What Are the Biggest Hurdles to Watch Out For?
If you ask anyone who's been in the trenches, they'll likely point to the same three challenges:
- Data Quality and Silos: The raw data is often messy, inconsistent, and locked away in systems that don't talk to each other. Getting it clean and integrated is a massive lift.
- Privacy and Compliance: Navigating the maze of regulations like HIPAA and GDPR is non-negotiable and requires constant vigilance.
- Finding the Right People: There’s a real shortage of professionals who have a deep understanding of both the clinical world and data science.
This is exactly why frameworks like the OMOP Common Data Model exist-they provide a direct, powerful solution to that first and often most difficult problem of data interoperability.
Is This Only for Big Hospital Systems?
Not at all. Analytics isn't just for massive academic medical centers. Smaller clinics and independent hospitals can see huge benefits.
Think about using data to optimize your patient scheduling, better manage chronic diseases across your local patient base, or streamline your revenue cycle. For smaller organizations, the trick is to start small with a very specific problem you want to solve. Modern cloud tools have made healthcare analytics much more accessible, so you can get started without a huge capital investment.
Ready to eliminate the biggest bottleneck in your OMOP pipeline? OMOPHub provides instant API access to all OHDSI ATHENA vocabularies, saving your team months of engineering effort. Explore the developer-first platform today.


