Healthcare Analytics: Turn Data into Better Patient Care
Healthcare analytics is, at its heart, the practice of turning a sea of health-related data into clear, actionable insights. We take raw information from countless sources-electronic health records, patient wearables, billing systems, and more-and use it to guide better clinical and operational decisions. The goal is always to improve patient outcomes and make our hospitals run more efficiently.
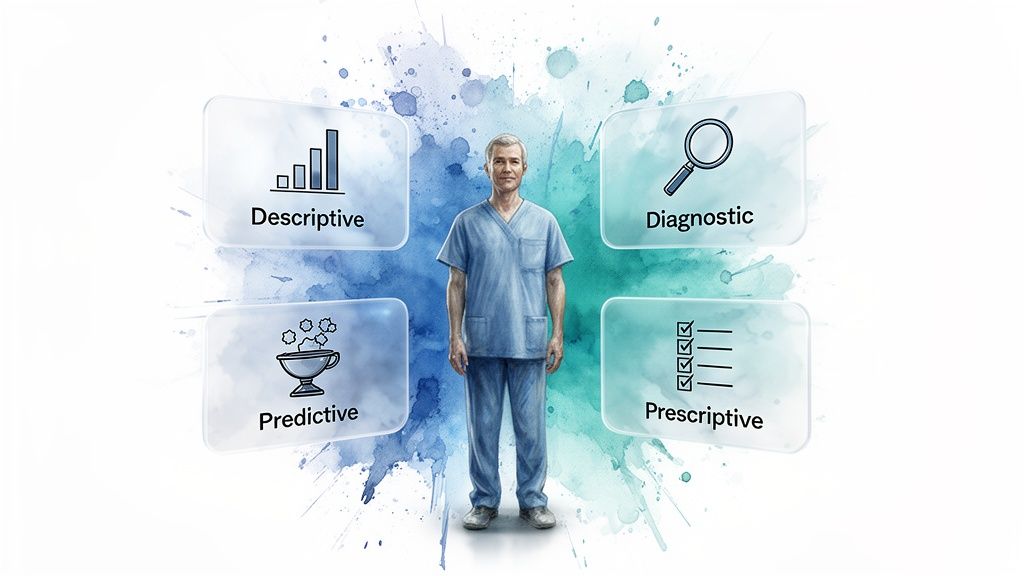
The Four Pillars of Healthcare Analytics
Think of healthcare analytics as a journey of asking progressively smarter questions. You start with the basics and build from there, moving from simply looking at the past to actively shaping the future. To really get a handle on it, it's best to break the process down into four distinct types of analytics, each one building on the last.
From Hindsight to Foresight
This evolution from basic reporting to sophisticated, automated recommendations is what gives modern analytics its power. The global healthcare analytics market is growing at a breakneck pace, projected to jump from about USD 64.49 billion in 2025 to a massive USD 369.66 billion by 2034.
That’s a compound annual growth rate (CAGR) of 21.41%, which tells you just how seriously organizations are taking the challenge of managing and interpreting massive datasets. This shift is a core part of the wider digital transformation in the healthcare industry.
Key Takeaway: The ultimate goal is to move beyond just understanding what happened. We want to accurately predict what's coming next and, most importantly, figure out the best thing to do about it before it happens.
To make this tangible, let's walk through a common hospital problem: high patient readmission rates for a specific cardiac procedure. Here’s how the four types of analytics would tackle it, step-by-step.
1. Descriptive Analytics (What Happened?)
This is ground zero. You have to start by looking at what the historical data tells you. A quick look at a dashboard might reveal that the 30-day readmission rate for the procedure is 18%, which you know is well above the national average. This is your baseline-the simple, unvarnished fact of what occurred.
2. Diagnostic Analytics (Why Did It Happen?)
Okay, you know the "what." Now it's time to figure out the "why." Analysts start digging deeper, correlating readmission data with other factors. Soon, a pattern emerges: patients who missed their first follow-up appointment after discharge had a 45% higher chance of being readmitted. The root cause wasn't the surgery; it was poor post-discharge follow-up.
3. Predictive Analytics (What Will Happen Next?)
This is where things get interesting. Armed with that insight, a data science team can build a machine learning model. The model analyzes patient demographics, existing health conditions (comorbidities), and even social determinants of health to generate a risk score. It can now accurately flag new patients who are most likely to miss their appointment and, therefore, be readmitted.
4. Prescriptive Analytics (What Should We Do?)
Finally, the system doesn't just predict a problem-it recommends a solution. For patients flagged as high-risk, the system might automatically trigger a series of actions: schedule a telehealth visit, dispatch a community health worker for a home check-in, or send a series of personalized text reminders. It prescribes a specific intervention to prevent the bad outcome it predicted.
To help you keep these straight, here's a quick summary of the four types.
The Four Types of Healthcare Analytics
| Type of Analytics | Core Question | Healthcare Example |
|---|---|---|
| Descriptive | What happened? | A report shows that patient wait times in the ER increased by 15% last quarter. |
| Diagnostic | Why did it happen? | Further analysis reveals the spike correlates with a nursing staff shortage on Tuesdays. |
| Predictive | What will happen? | A model forecasts a 20% increase in flu cases next month based on historical trends and community data. |
| Prescriptive | What should we do? | The system recommends increasing staffing levels and opening a dedicated flu clinic to manage the predicted surge. |
This structured progression is the foundation of any truly data-driven healthcare organization. It provides the framework for the more technical workflows we're about to explore, and you can learn more about how to unlock the potential of this data with OMOP CDM.
Navigating the Complex World of Healthcare Data
Let's be honest: the hardest part of healthcare analytics isn't the fancy algorithms or the complex machine learning models. It's the data. Healthcare data is a chaotic, fragmented mess, pulled from dozens of different systems that were never built to talk to each other. This is the foundational roadblock that trips up almost every analytics project before it even gets off the ground.
Think about all the different streams of information. You have structured data from Electronic Health Records (EHRs) that painstakingly document every clinical visit. Then you have claims data from insurance companies, which paints a financial picture of a patient's care. On top of that, a flood of patient-generated health data from wearables and apps gives us a real-time peek into their daily lives.
The Problem of Many Languages
The fundamental issue every data engineer runs into is that these sources don't speak the same language. A diagnosis coded in one hospital's EHR might use a local, proprietary term. A lab test from a different system might use a completely different name for the exact same measurement. Trying to stitch this data together for analysis is like trying to write a coherent story using pages torn from books written in different languages.
This lack of a common ground makes large-scale, reproducible research a nightmare. How can you possibly study how well a treatment works across thousands of patients if you can't be sure you're even looking at the same conditions, procedures, or drugs?
This is the central bottleneck in healthcare analytics. Before any real analysis can happen, we have to translate all this messy, multilingual data into a single, standardized format that every person-and every system-can understand.
To get this done, the industry leans on a powerful concept called a Common Data Model (CDM).
Creating a Universal Translator for Health Data
A Common Data Model is best understood as a universal translator for health information. It creates a standardized blueprint-a common format and terminology-that all data can be mapped into, no matter where it came from. One of the most successful and widely used CDMs out there is the Observational Medical Outcomes Partnership (OMOP) Common Data Model.
The OMOP CDM neatly organizes all this disparate information into a consistent set of tables that represent core clinical concepts:
- Persons: Demographics for each individual.
- Condition Occurrences: All diagnoses and medical problems.
- Drug Exposures: A record of every medication a patient has taken.
- Procedure Occurrences: Surgeries, therapies, and other interventions.
- Measurements: Lab results, vital signs, and other observations.
By converting raw source data into this standardized structure, we build a single, unified view of the patient's entire journey. This is what unlocks powerful, large-scale analytics that can be repeated across different organizations and datasets. Of course, given the sensitive nature of this information, a rock-solid approach to big data and security is an absolute must when building these unified databases.
The Dictionary for the Universal Language
A universal translator is pretty useless without a dictionary. For the OMOP CDM, that "dictionary" is a set of standard vocabularies. These are meticulously curated terminologies that provide one, and only one, unambiguous code for every clinical idea.
Some of the most important standard vocabularies include:
- SNOMED CT: The go-to for clinical findings, symptoms, and diagnoses.
- LOINC: Used for all laboratory tests and clinical observations.
- RxNorm: The standard for medications and their active ingredients.
Mapping all the local, source-specific codes to these standard vocabularies is a non-negotiable step. It's what ensures that when your analysis looks for "Type 2 diabetes," you're actually capturing every patient with that condition, regardless of how it was first written down. For a more detailed look at these concepts, check out the OMOPHub vocabulary documentation. This foundational work of standardization is what turns a mountain of chaotic data into a priceless asset for improving patient care.
Building Your First OMOP ETL Pipeline
Moving from the theory of data models to actually building something is where the real work in healthcare analytics begins. The engineering backbone for this entire effort is the ETL (Extract, Transform, Load) pipeline, a process that turns raw, messy source data into a structured, analysis-ready OMOP database. Think of it as a data factory, designed to take chaotic inputs and produce a pristine, standardized output.
The journey kicks off with the Extract phase. This is where you pull data from its native home, which could be anything from a hospital's EHR database, a folder of flat files from a billing system, or live data streams from clinical trial software. The goal here is simple: gather all the raw ingredients before the real refinement begins.
Next comes the Transform phase-by far the most complex and crucial part of the workflow. This is where the magic happens. You clean the raw data, validate it, and, most importantly, map it to OMOP's standard structures and vocabularies. It involves writing intricate logic to ensure that a local, proprietary code for a lab test, for instance, gets correctly translated into its universal LOINC equivalent.
The visual below gives you a simplified look at how this data standardization process works, pulling from disparate sources into the unified OMOP CDM.
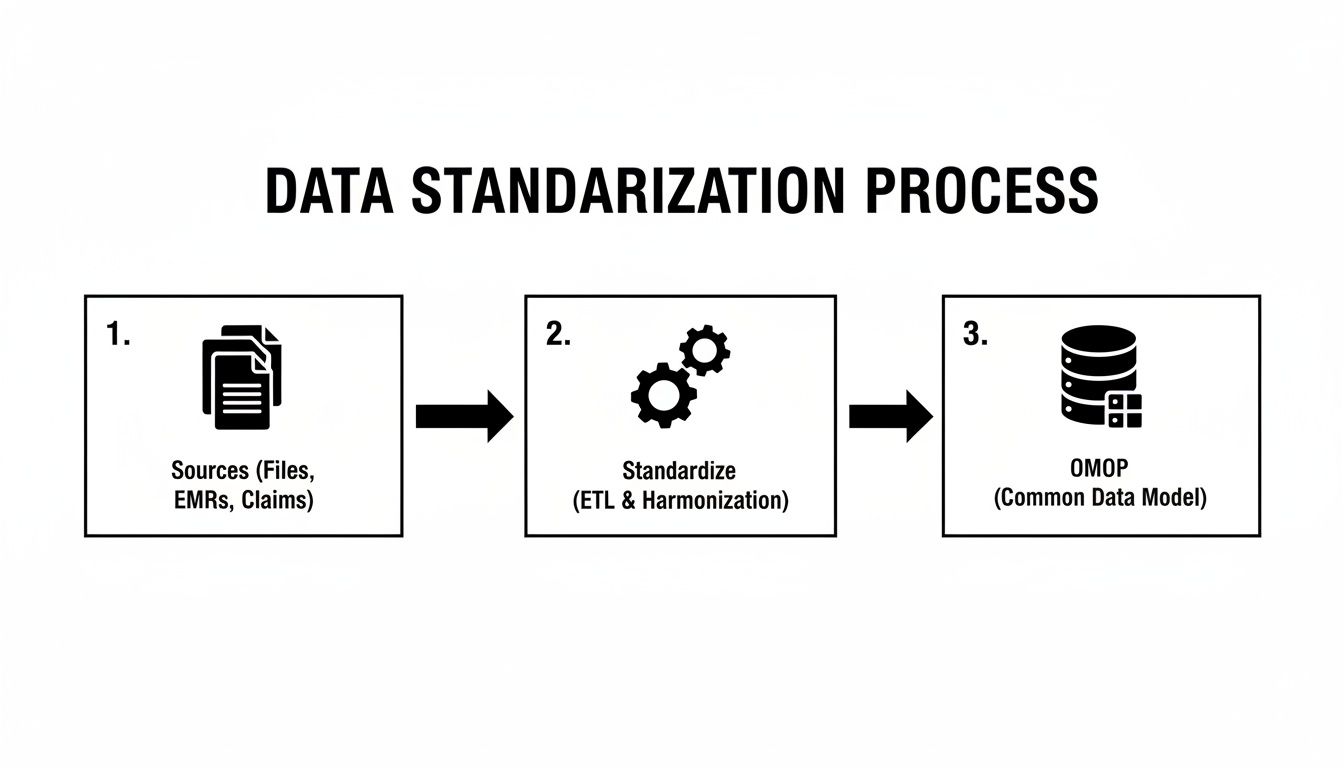
This diagram gets to the heart of why an OMOP ETL pipeline is so powerful: it creates a single source of truth that allows for consistent, scalable analysis. The final Load step is mechanically much simpler; it's just about inserting the clean, transformed data into the tables of your target OMOP database.
The Vocabulary Mapping Bottleneck
If you ask anyone who's built an OMOP pipeline, they'll tell you the same thing. The most common bottleneck, without a doubt, is vocabulary mapping. This task involves translating millions of source-specific codes-for diagnoses, drugs, procedures, and measurements-into their standard concept equivalents from vocabularies like SNOMED CT, RxNorm, and LOINC.
Traditionally, this has been a huge headache. Data engineering teams had to download, host, and maintain massive vocabulary databases that are often tens of gigabytes in size, just to perform the necessary lookups. This old-school approach creates a ton of operational overhead:
- Infrastructure Costs: You're on the hook for setting up and managing a dedicated database server just for the vocabularies, which is both expensive and resource-intensive.
- Maintenance Burden: Vocabularies are constantly updated. This means someone has to manually download new versions from ATHENA and go through the tedious process of updating the local database.
- Performance Tuning: Making sure that database is optimized for the high volume of queries an ETL run generates can feel like a full-time job in itself.
All this infrastructure management is a major distraction from the team's real goal: building effective data pipelines. It's a classic case of undifferentiated heavy lifting.
A Modern Approach to Vocabulary Mapping
Fortunately, modern tools are now available that can completely eliminate this layer of complexity. Services like OMOPHub provide REST API access to the complete set of OHDSI vocabularies, turning what used to be a cumbersome database management chore into a simple API call.
Instead of hosting a local vocabulary database, you can integrate a lightweight SDK into your ETL script, use an API key, and perform real-time vocabulary lookups. This creates a much more efficient workflow for anyone working in healthcare analytics. You can find all the details on the available endpoints in the official OMOPHub documentation.
By decoupling the vocabulary from the ETL process, teams can focus entirely on the transformation logic itself. This accelerates development, reduces infrastructure costs, and ensures the vocabulary data is always up-to-date without any manual intervention.
Practical Tips for Building Your ETL Script
When you sit down to write the code for your pipeline, a few best practices can make a world of difference. Here are some tips, with a few examples using the OMOPHub Python SDK to show how remote vocabulary lookups work in practice.
1. Create Reusable Mapping Functions
Don't write custom lookup logic for every single data column. Instead, build a generalized function that takes a source code and vocabulary ID as input, then returns the standard concept.
import os
from omophub.client import OmopHubClient

# Initialize the client with your API key
client = OmopHubClient(api_key=os.environ.get("OMOPHUB_API_KEY"))

def get_standard_concept(source_code, source_vocabulary_id):
    """
    Searches for a source concept and returns its standard mapping.
    """
    try:
        response = client.concepts.search_source_concept(
            source_code=source_code,
            source_vocabulary_id=source_vocabulary_id
        )
        # Assuming the first result is the desired one
        if response.items:
            # A source concept can map to multiple standard concepts.
            # Here, we select the first standard concept in the list.
            if response.items[0].standard_concepts:
                return response.items[0].standard_concepts[0]
        return None
    except Exception as e:
        print(f"An error occurred: {e}")
        return None

# Example usage for a diagnosis code
standard_concept = get_standard_concept(source_code="401.9", source_vocabulary_id="ICD9CM")
if standard_concept:
    print(f"Standard Concept ID: {standard_concept.concept_id}")
    print(f"Standard Concept Name: {standard_concept.concept_name}")
You can explore the OMOPHub Python SDK on GitHub for more examples.
2. Implement Robust Error Handling and Logging
Let's be realistic: not every source code will have a direct standard mapping. Your pipeline needs to handle these situations gracefully. Instead of crashing, it should log unmapped codes for later review. This is absolutely critical for maintaining data quality.
3. Cache Frequent Lookups
If you're processing a large dataset, you're going to see the same source codes over and over again. Implementing a simple in-memory cache (like a Python dictionary) can dramatically cut down on the number of API calls you make and speed up your ETL job significantly. If you want to better understand the underlying data structures, you might find our guide on the OMOP data model and its benefits helpful.
4. Parameterize Your Scripts
Avoid hardcoding values like source vocabulary names or database credentials directly in your code. Use configuration files or environment variables. This makes your ETL scripts far more flexible and easy to adapt to different data sources or environments. The same principles apply if you're working in R, and you can check out the corresponding OMOPHub R SDK on GitHub.
Getting Vocabularies Right: The Key to Accurate Data Mapping
At the very core of healthcare analytics lies vocabulary mapping-a process that’s as critical as it is challenging. It’s easy to underestimate this step, seeing it as just another technical task, but it’s really about semantics. It’s about ensuring every piece of data means the same thing, everywhere.
Think about it: when you map a local hospital’s proprietary drug code to the universal RxNorm standard, or translate a lab test's internal name to its official LOINC equivalent, you're making analysis possible. This is what lets you compare patient outcomes across different hospitals and health systems, confident you're truly comparing apples to apples. If you get this wrong, your insights are built on a shaky foundation of ambiguity.
Practical Strategies for Data Mapping
So, how do data engineers actually achieve this consistency? The approach really depends on the quality and messiness of the source data.
- Rule-Based Mapping: This is the most straightforward method. If a source system always uses the code "HYPER" for hypertension, you can write a simple script to map "HYPER" to its official SNOMED CT concept ID. This works beautifully for clean, predictable data, but that’s often a luxury.
- NLP for Unstructured Data: Clinical notes are a goldmine, but they’re unstructured text. This is where Natural Language Processing (NLP) comes in. You can train models to read through free-text fields, identify clinical terms like diagnoses or medications, and link them to standard vocabulary concepts.
- Human-in-the-Loop Review: Automation has its limits. For the most obscure or infrequent terms, algorithms often fail. A human-in-the-loop system flags these unmapped terms, sending them to a clinical informatics expert for review. That expert makes the definitive call, and their decision can then be used to train future automated models, making the system smarter over time.
The accuracy of your entire analytics platform hinges on the quality of your vocabulary mapping. A single misinterpreted code can cascade through your analysis, leading to flawed conclusions and misguided clinical or operational decisions.
The Hidden Burden of Vocabulary Infrastructure
While the mapping logic itself is complex, there’s another massive, often hidden, challenge: the engineering overhead of just maintaining the vocabularies. These terminologies aren't static; they get updated all the time with new codes, retired terms, and revised relationships.
This means organizations have to dedicate a surprising amount of resources to downloading, hosting, and managing these huge, multi-gigabyte databases. This ongoing maintenance is a constant drain on engineering teams, pulling them away from their actual goal of building analytics that deliver value. The financial hit is real, too. After all, healthcare analytics is a major factor in financial management and is projected to capture 40.70% of market revenue in 2025 by helping hospitals optimize their revenue cycles. With the overall U.S. market set to grow from USD 15.85 billion in 2024 to USD 19.65 billion in 2025, the investment in getting this right is immense.
A Modern, API-First Way Forward
This is exactly the problem a managed service like OMOPHub solves. Instead of spending time and money building and maintaining your own vocabulary infrastructure, your developers can access always-current, comprehensive terminologies with a simple API key.
This modern approach completely removes the infrastructure burden. Developers can use a lightweight SDK to plug vocabulary lookups directly into their ETL scripts and applications. They can finally focus their energy on building smart mapping logic instead of wrestling with database updates. Not only does this speed up development, but it also guarantees your analytics are always running on the latest, most accurate terminologies. You can learn more by exploring the world of semantic mapping in healthcare.
For developers ready to ditch the old way of managing vocabularies, our open-source SDKs offer a clear path:
- For Python Developers: Check out the OMOPHub Python SDK on GitHub.
- For R Programmers: Explore the OMOPHub R SDK on GitHub.
Building Analytics and AI Models on OMOP Data
Once your data is cleaned, standardized, and loaded into the OMOP Common Data Model, you've finally reached the starting line. All that painstaking data engineering work now gives way to the really exciting part: data science. This is where you can start building powerful analytics and AI models that deliver real clinical and operational value.
The OMOP CDM is much more than a storage format; it's a launchpad for discovery. With every piece of data having a consistent structure and meaning, you can run complex queries and develop models that would be flat-out impossible with raw, siloed source data. This transition from data prep to insight generation is the entire point of a serious healthcare analytics program.

From Cohort Definition to Feature Engineering
The journey into advanced analytics almost always begins with a simple question: "Who are the patients we want to study?" This process, known as cohort definition, is all about writing queries to isolate specific patient populations based on shared characteristics. For example, a research team might want to find all patients diagnosed with type 2 diabetes who were prescribed metformin and later experienced a specific adverse event.
Thanks to OMOP, writing that query is surprisingly straightforward. Instead of hunting through a dozen proprietary code systems, you just query a single, standard SNOMED CT concept for diabetes and a standard RxNorm concept for metformin. This standardization dramatically simplifies the process of defining and refining patient groups for analysis.
After defining a cohort, the next step is often feature engineering for machine learning. This is the art of creating the variables (features) a model will use to make predictions. To build a model that predicts the risk of hospital readmission, for instance, you might create features like:
- The number of prior hospitalizations in the last 12 months.
- The presence of specific comorbidities like congestive heart failure or chronic kidney disease.
- The total count of unique medications prescribed at discharge.
- The patient's age and other demographic factors.
Because the data is already in a clean, tabular format, data scientists can focus on creatively constructing meaningful features instead of getting bogged down in basic data cleaning.
Designing Scalable Analytics Architectures
As your analyses get more complex, so do the demands on your technical architecture. Interactive dashboards that let clinicians explore patient data in near real-time require a completely different setup than large-scale model training jobs that might run for hours. A successful healthcare analytics platform has to handle both interactive and batch workloads efficiently.
Every single component in the data pipeline needs to be performant. A small bottleneck anywhere can bring a real-time application to a grinding halt, especially for frequently called services like vocabulary lookups.
Think about an application that needs to translate clinical code IDs into human-readable names for a user interface. That has to happen instantly. A high-performance vocabulary service like OMOPHub, which offers typical response times of less than 50 milliseconds, ensures those lookups don't create a laggy user experience, making even demanding real-time analytics possible.
Practical Tips for Building on OMOP Data
Building effective models on OMOP data takes more than just good data science; it requires a smart approach to querying and tool selection. Here are a few practical tips to get you started.
- Use OHDSI Tools for Cohort Definition: The Observational Health Data Sciences and Informatics (OHDSI) community provides fantastic open-source tools like ATLAS. It gives you a graphical interface for building complex cohorts without writing raw SQL, which can seriously speed up the initial stages of a project.
- Master Concept Sets: Don't just query for single concept IDs. Group related concepts into "concept sets." For instance, a concept set for "antihypertensive drugs" would bundle all relevant RxNorm codes, making your queries far more comprehensive and clinically accurate. You can learn more about finding these relationships through the OMOPHub concept relationship documentation.
- Optimize Your Query Performance: When you're working with massive OMOP databases, a poorly written query can be painfully slow and expensive to run. Use database execution plans to spot performance bottlenecks and make sure you have proper indexes on frequently queried columns like
person_id,concept_id, and date fields. - Leverage SDKs for Programmatic Access: For building automated pipelines or applications, integrate tools like the OMOPHub Python SDK or OMOPHub R SDK. This lets your code interact with standardized vocabularies programmatically-an essential capability for tasks like live feature engineering or mapping new data streams on the fly.
By adopting these practices, you can turn your OMOP CDM from a static data repository into a dynamic engine for discovery, driving the next wave of data-informed healthcare.
Common Questions About Healthcare Analytics
As developers and data scientists start working with health data, a few practical questions almost always bubble up. Let's tackle some of the most common ones head-on, touching on the real-world hurdles you're likely to face.
What Is the Biggest Challenge in Healthcare Analytics?
Without a doubt, the single biggest roadblock is data interoperability and quality. Healthcare data is a mess. It's scattered across countless systems, locked in different formats, and described using proprietary codes. This chaos makes meaningful analysis a nightmare right from the start.
The painstaking process of cleaning up this data, running it through ETL pipelines, and mapping it to a common data model like OMOP consumes an enormous amount of resources. Frankly, this initial data wrangling is where most projects get bogged down, burning through time and money before a single insight is generated.
This is precisely why tools that streamline vocabulary mapping and data standardization are so critical. They attack the most significant bottleneck in the entire analytics workflow, freeing up your team to actually analyze data instead of just fighting with it.
How Does the OMOP CDM Promote Reproducible Research?
The OMOP Common Data Model is the bedrock of reproducible research in healthcare. By standardizing the data's structure and enforcing a shared vocabulary, it transforms datasets from different hospitals or research centers into something that looks and feels identical.
This means analysis code written for one OMOP database can be shared and run on another with very few changes. It’s a simple concept with a massive impact:
- It boosts transparency, letting other researchers easily validate your findings.
- It unlocks large-scale studies by combining diverse patient populations.
- It fuels collaboration through networks like OHDSI, which provides a suite of open-source tools built specifically for OMOP-formatted data.
In essence, the OMOP CDM turns a collection of isolated, messy datasets into a federated network of interoperable information. For medical research, that’s a complete game-changer.
How Should I Handle Security and Compliance?
Security and compliance, especially with regulations like HIPAA, are non-negotiable. There's no room for error. An effective strategy demands a multi-layered approach that protects sensitive patient information at every single step.
Your security plan should always have these core components:
- De-identification: Strip or obscure Protected Health Information (PHI) from datasets whenever possible. This is especially crucial for research and analytics use cases.
- Access Control: Implement strict, role-based access controls. Users should only see the absolute minimum data required for their job-nothing more.
- Encryption: Your data has to be encrypted both in transit (using TLS) and at rest (using database and storage encryption). This is table stakes.
- Audit Logs: Keep immutable audit logs of all data access and API calls. You need a crystal-clear record of who touched what data, and when.
When you bring third-party services like OMOPHub into your pipeline, you absolutely must verify their security posture. Look for non-negotiable features like end-to-end encryption and detailed API usage logs, which are essential for meeting enterprise security and regulatory demands.
What Is a Good First Project for My Team?
A great first project is one with a clear, measurable goal that delivers tangible value-and fast. Don't try to boil the ocean. Instead, zero in on a specific clinical or operational problem that people actually care about.
Here are a few tips for picking a smart starting point:
- Start with Descriptive Analytics: Before you jump to fancy predictions, just describe what's happening. Build a simple dashboard that tracks a key metric, like 30-day hospital readmission rates for a specific surgery.
- Focus on a Single Data Source: Don't try to integrate everything at once. Pick one relatively clean source, like billing claims, to prove out your ETL pipeline and mapping strategy first.
- Use Existing Tools: Lean on open-source libraries and community tools to get moving faster. For instance, using the OMOPHub Python SDK can save you from the headache of building a vocabulary management system from scratch.
- Solve a Known Pain Point: Find a problem that clinicians or administrators are already complaining about. This guarantees you’ll have engaged stakeholders who are eager to help validate your results.
By starting small and delivering a quick win, you build the momentum and trust needed to tackle more ambitious healthcare analytics projects down the road.
Ready to stop wrestling with healthcare vocabulary infrastructure? With OMOPHub, you get instant REST API access to all OHDSI vocabularies, letting you build robust ETL pipelines and analytics applications much faster. Learn more and get your API key at OMOPHub.


