Rheumatoid Arthritis vs Psoriatic Arthritis: A Data-Driven Comparison

At first glance, rheumatoid arthritis and psoriatic arthritis might seem similar—both are chronic, inflammatory autoimmune diseases that cause significant joint pain. For data professionals building patient cohorts or analytical models, however, the distinctions are critical. Their origins and clinical presentations are fundamentally different, and understanding these nuances is the key to accurate data extraction and analysis.
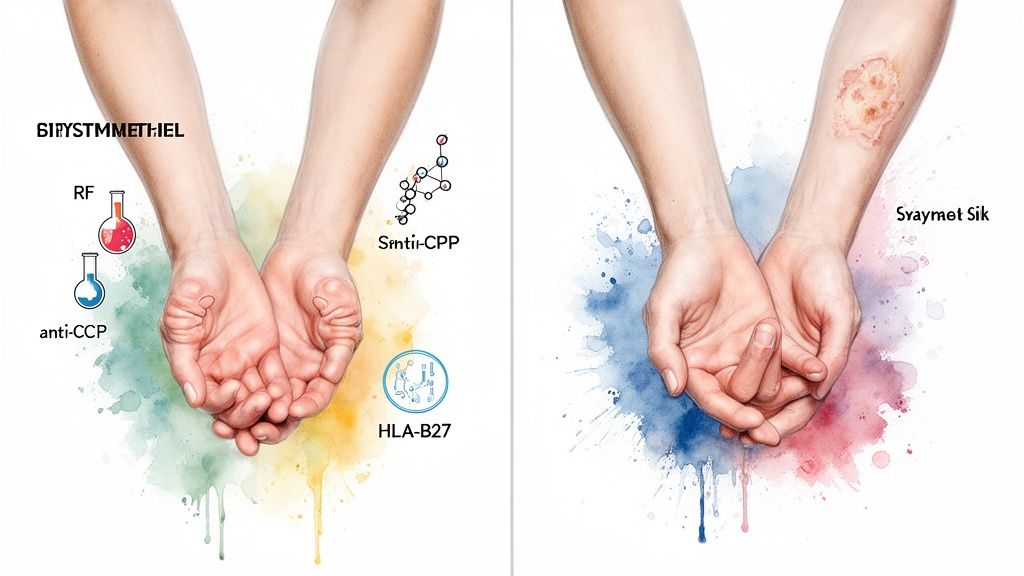
Rheumatoid arthritis (RA) is a systemic disease that primarily goes after the joint lining, or synovium. This attack results in a hallmark sign: symmetrical joint inflammation. If one wrist is affected, the other one usually is, too.
In contrast, psoriatic arthritis (PsA) is a spondyloarthropathy, a family of inflammatory diseases that includes ankylosing spondylitis. It's closely tied to the skin condition psoriasis and often presents with asymmetrical joint involvement. You might also see dactylitis (painfully swollen 'sausage digits') and enthesitis, which is inflammation where tendons and ligaments attach to bone.
Distinguishing RA and PsA Clinical Profiles
For anyone working with clinical data, these differences aren't just academic. They translate directly into unique patterns and markers within electronic health records (EHRs). Recognizing the distinct clinical footprints of RA and PsA is the first step toward building clean, reliable datasets for research or analytics.
Let's break down the core pathological and serological markers that help differentiate these two conditions.
Core Pathological and Serological Markers
The primary target in RA is the synovium. The resulting symmetrical pattern, especially in the small joints of the hands and feet, is a classic feature you can look for when parsing through patient records.
PsA, on the other hand, is a different beast. Its link to psoriasis is intrinsic, and the inflammation can show up asymmetrically. The presence of enthesitis is a particularly powerful differentiator, often documented in unstructured clinical notes as pain in the heel or other specific insertion points.
Key Takeaway for Data Analysis: The presence of a psoriasis diagnosis is one of the strongest initial filters for separating potential PsA patients from an RA population. In fact, about 85% of people with PsA have a history of psoriasis.
This table gives a high-level view of the key differentiating factors.
| Feature | Rheumatoid Arthritis (RA) | Psoriatic Arthritis (PsA) |
|---|---|---|
| Joint Pattern | Symmetrical, often affecting small joints of hands and feet. | Asymmetrical, can impact both large and small joints. |
| Primary Association | Systemic autoimmune disease with no skin component. | Strongly linked to skin and nail psoriasis. |
| Key Serological Marker | Frequently positive for RF and anti-CCP antibodies. | Often seronegative (RF/anti-CCP negative); associated with HLA-B27. |
| Unique Clinical Signs | Rheumatoid nodules are a classic finding. | Dactylitis (swollen digits) and enthesitis are hallmark signs. |
Practical Tips for Data Professionals
When you start a cohort-building project, defining your initial concept sets with care is paramount. A sloppy start leads to a messy, unreliable dataset.
Here are a few tips to ensure accuracy right from the beginning:
- Prioritize Skin Condition Codes: If you're building a PsA cohort, start by identifying patients with a psoriasis diagnosis (like the ICD-10 L40 series) before you even look for arthritis codes.
- Lean on Lab Data: Use LOINC codes to query for Rheumatoid Factor (RF) and anti-CCP antibody tests. High positive titers are a strong signal for RA.
- Use SDKs for Repeatable Workflows: To make your work reproducible and easy to update, manage your concept sets programmatically. Tools like the OMOPHub Python SDK or its R SDK are perfect for this. For more guidance, check out the official OMOPHub documentation.
- Pro Tip: You can find detailed code examples for using the SDKs to manage concept sets in the official documentation. For instance, creating and managing a new concept set can be done with just a few lines of code, ensuring your definitions are version-controlled and reusable. See the full examples at https://docs.omophub.com.
A Tale of Two Numbers: Epidemiology and Prevalence
When you start digging into the data on rheumatoid and psoriatic arthritis, the first thing that jumps out is just how different their numbers are. These aren't just figures for a research paper; they have real, tangible consequences for anyone working with healthcare data, dictating everything from data availability to the statistical methods you'll need to use.
The simple fact is that rheumatoid arthritis is far more common worldwide. In any large-scale health dataset you pull, you're going to find a lot more RA patients than PsA patients. This imbalance isn't a minor detail—it's a central challenge you have to confront, especially if you're building any kind of predictive model.
If your goal is a model that can tell the difference between the two, just feeding it raw data will almost guarantee a biased result. The model will naturally favor RA simply because it has so much more data to learn from. This is where you have to get hands-on with techniques like oversampling the PsA cases or undersampling the RA cases to give your model a fair shot at learning the nuances of both.
The Stark Difference in U.S. Prevalence
Looking at the numbers in the United States really drives the point home. Data from a comprehensive CDC study conducted from 2017 to March 2020 lays it all out. Among adults with a diagnosed form of arthritis, osteoarthritis is the giant at 49.6% (33.2 million). But right behind it is rheumatoid arthritis, accounting for a significant 15.8% of cases, or 10.6 million people.
And psoriatic arthritis? It’s way down the list at just 1.4%, which translates to about 1.0 million people.
This chart from the CDC's report paints a clear picture of just how wide the gap is between RA and PsA prevalence.
You can see immediately that RA is a major player in the arthritis landscape, while PsA is a much smaller, though still important, piece of the puzzle. This is the data imbalance we're up against.
Global Variations Complicate the Picture
The story gets even more complex when you zoom out to a global view. While RA is consistently more common everywhere, the prevalence of PsA can vary quite a bit by region. For example, PsA is seen more often in European populations than in Asian populations.
This kind of geographical skew is a huge consideration when you're trying to build international patient cohorts. A model or study built on data from one part of the world might not hold up when applied to another. It really highlights how essential data standardization is.
A Crucial Note on Standardization: If you're pulling data from multiple regions, standardizing your diagnostic codes is non-negotiable. You have to be sure that a "case" of PsA in Europe is defined and coded the same way as a case in Asia. This means mapping all those local codes to global standards like SNOMED CT and ICD-10 to create a dataset that's actually comparable and reliable.
This is where you move beyond manual, error-prone mapping and start thinking about programmatic solutions. Automating your vocabulary management isn't just a nice-to-have; it's a necessity for robust, scalable analysis.
Practical Steps for Handling the Data
- Check for Class Imbalance First: Before you even think about training a model, get a hard count of your RA vs. PsA patients. That ratio will dictate your entire sampling strategy.
- Segment by Geography: If you're working with a global dataset, don't treat it as a monolith. Break it down by region to see if prevalence differences are skewing your cohort.
- Automate Your Vocabulary Mapping: Don't get stuck in manual mapping spreadsheets. Use a tool like the OMOPHub Python SDK to programmatically map source codes to a standard terminology. You can find detailed instructions in the official OMOPHub documentation.
- Pro Tip: For mapping source codes, the OMOPHub SDKs (Python and R) offer functions to streamline the process. You can check the documentation for verified code examples on how to map a list of local codes to standard OMOP concepts, which is essential for harmonizing multi-site data.
Diving Into the Clinical and Diagnostic Details
When you move from population statistics to individual patient data, the real work of separating rheumatoid arthritis from psoriatic arthritis begins. It all comes down to the distinct clinical footprints each condition leaves in the patient record. These differences are the key to building accurate phenotyping algorithms. While both diseases cause joint pain, their specific patterns, associated signs, and lab results tell two very different stories.

The classic RA presentation is a symmetrical, small-joint polyarthritis. If a patient's left wrist is inflamed, their right wrist probably is too. This distinct symmetry is a powerful pattern that data scientists can hunt for in structured EHR data. PsA, on the other hand, is known for its more chaotic and varied presentation, often showing up as asymmetrical joint pain.
Contrasting Joint and Extra-Articular Manifestations
One of the most significant clues for psoriatic arthritis is the presence of psoriatic skin or nail disease. In fact, this precedes the arthritis in about 85% of cases, making a documented history of psoriasis an incredibly strong feature for your PsA cohort inclusion criteria. Beyond skin involvement, two hallmark features of PsA are dactylitis (the "sausage digit," where an entire finger or toe swells) and enthesitis (inflammation where tendons and ligaments attach to bone).
These tell-tale signs are often buried in unstructured clinical notes, which is why Natural Language Processing (NLP) is so indispensable here. Extracting terms like "sausage digit," "dactylitis," or "heel pain at insertion" can dramatically improve the precision of a PsA phenotype. To get this right, you first need a solid grasp of what a clinical phenotype truly represents. You can get a deeper understanding by reading our guide on what a phenotype means in the context of real-world data.
Crucial Differentiator for NLP Models: While both conditions cause joint swelling, the concept of dactylitis is highly specific to spondyloarthropathies like PsA. Training an NLP model to recognize and distinguish mentions of "joint swelling" versus "dactylitis" is a high-value task for improving classification accuracy.
Key Serological and Genetic Markers
Laboratory data provides another crucial layer for differentiation. RA is, for many patients, a famously seropositive disease.
- Rheumatoid Factor (RF): This antibody is found in the blood of a large majority of RA patients.
- Anti-CCP Antibodies: These are highly specific to RA and serve as a strong predictor of more aggressive disease progression.
PsA, by contrast, is typically seronegative—meaning both RF and anti-CCP tests come back negative. Instead, a key genetic marker to look for is HLA-B27, which is closely associated with the spondyloarthropathy family of diseases. While not a standalone diagnostic marker, finding it in a patient with inflammatory arthritis and psoriasis makes a PsA diagnosis far more likely than RA.
The table below offers a practical summary of these core differences. This is the kind of information data teams can directly translate into robust classification rules and feature sets for their algorithms.
Clinical and Diagnostic Feature Comparison RA vs PsA
| Feature | Rheumatoid Arthritis (RA) | Psoriatic Arthritis (PsA) |
|---|---|---|
| Joint Pattern | Symmetrical, small joints (hands, wrists, feet) | Asymmetrical; can affect large and small joints, including the spine |
| Extra-Articular Signs | Rheumatoid nodules, vasculitis | Psoriasis skin/nail disease, dactylitis, enthesitis |
| Key Lab Markers | Often positive for RF and anti-CCP antibodies | Typically negative for RF/anti-CCP; associated with HLA-B27 |
| Radiological Findings | Marginal erosions, joint space narrowing | "Pencil-in-cup" deformity, new bone formation |
By integrating these clinical, serological, and radiological features, you can create a much more nuanced and accurate picture of each disease, moving beyond simple diagnostic codes to build truly intelligent patient cohorts.
Navigating Data and Coding Complexities
For health data professionals, the distinction between rheumatoid arthritis and psoriatic arthritis isn't just clinical theory—it's a daily, practical challenge. Getting the coding and data mapping right within frameworks like the OMOP Common Data Model is fundamental to building clean, reliable patient cohorts. A mistake at this foundational level can easily corrupt an entire analysis and lead to completely wrong conclusions.
The real trouble starts when you dive into the nuances of medical coding systems. On the surface, it looks simple. ICD-10-CM codes for RA typically fall under the M05-M06 categories, while PsA is often found under L40.5x, which links it directly to psoriasis. But that clean separation gets messy fast in real-world data.
One of the most common pitfalls is the misclassification of seronegative RA. When the usual lab markers are absent, its clinical picture can look a lot like PsA, which often results in ambiguous or incorrect coding. Another frequent issue is on the data processing side—failing to computationally link a PsA diagnosis code to a pre-existing psoriasis code in the same patient’s record. That link is a critical piece of evidence, and without it, the diagnostic signal is much weaker.

This screenshot from the OMOPHub Python SDK GitHub repository shows how modern tools help manage these complex terminologies. By handling vocabularies programmatically, teams can build precise, version-controlled workflows that sidestep manual errors and ensure the work is reproducible.
Building Precise Concept Sets Programmatically
Let's be honest: manually managing lists of codes from different terminologies in a spreadsheet is a recipe for disaster. It's not just inefficient; it's incredibly prone to error. A much more solid approach is to build your concept sets programmatically using dedicated tools like the OMOPHub SDKs. These libraries give you a direct, API-driven way to interact with standardized vocabularies.
Instead of a static list of ICD-10 and SNOMED CT codes, you can write a script that queries the latest vocabulary version directly. This keeps your definitions current and compliant without you having to think about it. The process is laid out in the OMOPHub documentation, which has some great examples to get you started.
Key Insight for Data Engineers: Programmatic concept set creation is non-negotiable for reproducible research. It lets you version your cohort definitions right alongside your analysis code, creating an immutable and auditable record of exactly how a patient population was defined at a specific point in time.
Addressing Common Mapping Challenges
The differences in incidence and regional prevalence between RA and PsA reveal important epidemiological patterns. This is gold for biostatisticians and AI/ML teams building predictive models with OMOP data, where accurate SNOMED-to-ICD mappings can streamline cross-study comparisons. You can find more detail on these epidemiological patterns on PMC. This really underscores the need for precise vocabulary tools that can manage the complex web of relationships between coding systems.
Here are a few practical tips I've learned for cleaner data mapping:
- Establish a Hierarchy: When building a PsA cohort, make it a rule that a psoriasis diagnosis code (ICD-10 L40.- or its SNOMED equivalent) must be present within a set time window of the arthritis diagnosis. This adds a crucial layer of validation.
- Use Smart Exclusion Criteria: For an RA cohort, build an explicit exclusion set of concepts tied to PsA—like dactylitis or enthesitis—to really tighten up the specificity.
- Query Lab Results with LOINC: Don't just rely on diagnosis codes. Use LOINC codes to filter patients based on lab results. Requiring a positive anti-CCP test, for example, is one of the most powerful ways to confirm an RA diagnosis.
- Leverage RxNorm for Treatment Clues: Dig into the medication history using RxNorm codes. Certain treatment patterns can be strong indicators for one disease over the other, which is incredibly helpful in those gray-area cases.
- Pro Tip: Always verify your mapping logic. The SDK documentation at https://docs.omophub.com includes verified code snippets for mapping concepts between vocabularies like ICD and SNOMED. Using these examples helps prevent common mapping errors that can skew your results.
By bringing these strategies into your workflow, you can dramatically cut down on misclassification and build far more accurate datasets for your research. If you're interested in how these coding systems have evolved, our guide on ICD-10 to ICD-9 conversion provides some useful context on managing these vocabulary transitions.
Using Treatment Pathways to Refine Analysis
Beyond diagnoses and lab results, the treatment pathways for rheumatoid arthritis and psoriatic arthritis leave distinct data trails. These are incredibly valuable for analysis. When you map medication regimens using RxNorm, you start to see how therapeutic strategies split, even when clinicians are using similar drug classes like DMARDs or biologics. These patterns become powerful proxy indicators, helping to tell RA and PsA apart when diagnostic codes are ambiguous.
For instance, treatment decisions in PsA often hinge on the severity of skin symptoms versus joint involvement. A patient with severe psoriasis might get a biologic known to work on both, while an RA patient's treatment is aimed squarely at joint inflammation. This difference creates a unique prescription signature right there in the data.
Decoding Treatment Signatures in Prescription Data
The choice of first-line and subsequent therapies can be a surprisingly strong classifier. While methotrexate is a go-to DMARD for both conditions, the specific biologics that follow often diverge based on their mechanism of action and FDA-approved indications.
- RA-Dominant Biologics: Certain biologics are seen far more often in RA treatment plans because their efficacy is highly targeted to its core pathophysiology.
- PsA-Specific Therapies: Other drugs, especially those targeting the IL-17 or IL-23 pathways, are approved specifically for PsA, tackling both the joint and skin symptoms.
By analyzing the sequence of prescriptions captured with RxNorm codes, data scientists can engineer features that mirror these clinical decision-making processes. You can get a better handle on how medication codes work by reading our guide on the NDC code lookup process.
A Practical Tip for Feature Engineering: Don't just look at which drugs were prescribed—create features that capture the sequence of those medications. A patient starting on methotrexate and later escalating to an IL-17 inhibitor tells a very different story than one moving to another class of biologic. This provides a strong signal for a PsA phenotype. The OMOPHub documentation can guide you on structuring queries to extract drug eras and treatment sequences effectively.
Integrating Prognosis and Comorbidity Data
Prognosis data adds another critical layer for telling these two diseases apart in long-term outcome studies. RA, for example, is linked to a much higher risk of cardiovascular events compared to PsA. This difference shows up in patient records through comorbidity codes, lab results like lipid panels, and prescriptions for heart-related medications.
Mortality risks and comorbidity profiles are another area where RA and PsA diverge sharply. This offers vital context for researchers, especially those using versioned data to track disease progression, like the transition from psoriasis to PsA (SNOMED 9014002 to L40.5) versus RA's standalone codes. You can discover more insights about these mortality risk findings from psoriasis-hub.com.
By weaving these long-term outcome patterns into the analysis, researchers can design more robust studies and build predictive models that are sensitive to the unique trajectory of each disease. For example, a model built to predict adverse events would need to weigh cardiovascular risk factors more heavily for an RA cohort. This kind of analytical depth is what takes you from simple classification to generating meaningful, real-world evidence.
Answering Common Questions on Differentiating RA and PsA in Clinical Data
When you're in the weeds of parsing clinical datasets, telling the difference between rheumatoid and psoriatic arthritis can be a real headache. Getting it right is crucial for building accurate patient cohorts and trustworthy analytical models. Let's tackle some of the most frequent hurdles data professionals face with practical, data-centric advice.
The flowchart below gives a high-level view of the clinical decision process. It clearly shows how a single data point, like the presence of skin symptoms, can become a critical fork in the road when analyzing treatment pathways.
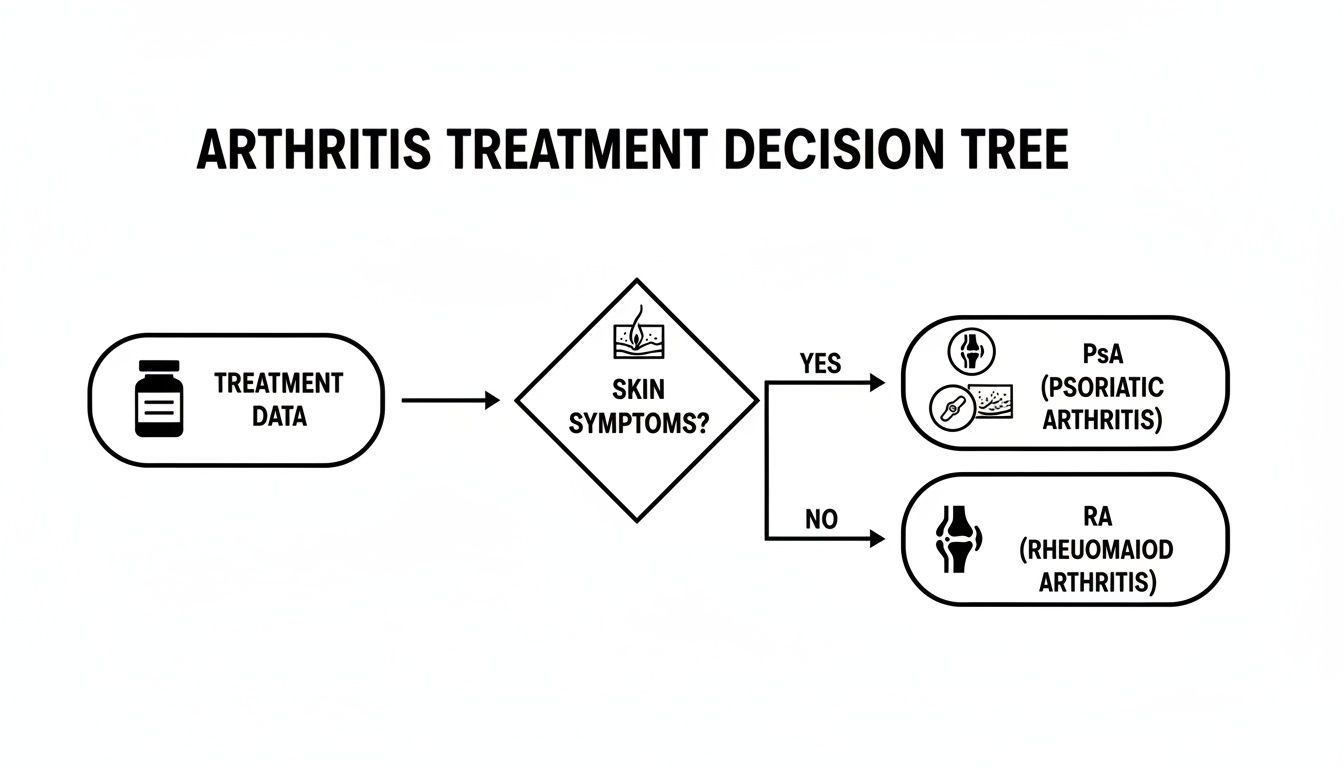
This visual really drives home the point: layering clinical observations, like the presence or absence of psoriasis, on top of treatment history is a powerful way to separate these two conditions in your data.
How Do You Distinguish Seronegative RA from PsA?
This is a classic problem. How do you tell seronegative RA from PsA in a dataset when the key lab markers are missing? Without positive RF or anti-CCP antibodies, you lose a primary RA flag, and the conditions start to look frustratingly similar in the data.
The key is to move beyond serology and look at the whole picture. Dig into other coded data points. Start by analyzing records for joint distribution patterns. You'll find that SNOMED CT codes indicating symmetrical joint involvement are a strong signal for RA, whereas asymmetrical patterns point you toward PsA. You should also query for codes specific to dactylitis or enthesitis, which are classic signs of PsA.
Finally, a linked diagnosis of psoriasis, coded with ICD-10 L40, is often the smoking gun. Your RxNorm codes can also offer solid clues, as certain biologic therapies are more commonly prescribed for one condition over the other.
Data Pro Tip: When building a phenotype, don't rely on a single feature. Instead, create a scoring system. You can award points for symmetrical joint patterns (suggesting RA), a psoriasis diagnosis (suggesting PsA), and other specific extra-articular features. This quantitative approach is a great way to handle the ambiguity in more complex patient profiles. Check the SDKs (Python, R) for examples of how you might programmatically implement such scoring logic against your OMOP data.
What Are the Best Practices for Building a PsA Cohort?
When building a clean Psoriatic Arthritis cohort in the OMOP Common Data Model, your goals should be precision and reproducibility. The first step is to create a concept set with specific PsA codes from both SNOMED and ICD-10. You can manage this programmatically using tools like the OMOPHub Python SDK, which is designed to handle complex terminologies.
To sharpen that initial cohort, you need to apply strict inclusion criteria. A crucial step is requiring evidence of a psoriasis diagnosis within a reasonable time frame of the arthritis diagnosis. This helps filter out other inflammatory joint diseases that might have been miscoded.
Next, you'll want to build a robust exclusion list to remove any patients with a clear RA diagnosis. This list should include concepts for positive RF or anti-CCP lab tests, along with specific RA diagnostic codes. Consulting resources like the OMOPHub documentation can offer solid guidance on building and managing these version-controlled concept sets via an API.
Which LOINC Codes Are Most Useful?
So, which LOINC codes are the most valuable for splitting RA from PsA? You should concentrate on the codes for the serological and genetic lab tests that provide the clearest distinction between the two.
- High titers of Rheumatoid Factor (RF) are a classic indicator of RA.
- Anti-cyclic citrullinated peptide (anti-CCP) antibodies are even more specific to RA and are a very strong signal.
- The presence of HLA-B27 is more suggestive of spondyloarthropathies like PsA, although it isn't a definitive diagnostic marker on its own.
Querying for these specific LOINC codes in your lab results is fundamental for building precise phenotype algorithms. Integrating these biological markers adds a layer of confirmation that you simply can't get from diagnosis codes alone.
At OMOPHub, we get rid of the infrastructure headache that comes with managing complex healthcare vocabularies. Our developer-first platform gives you instant REST API access to OHDSI ATHENA terminologies, so your team can build accurate, reproducible data pipelines and analytical models faster. Start building with confidence at https://omophub.com.

